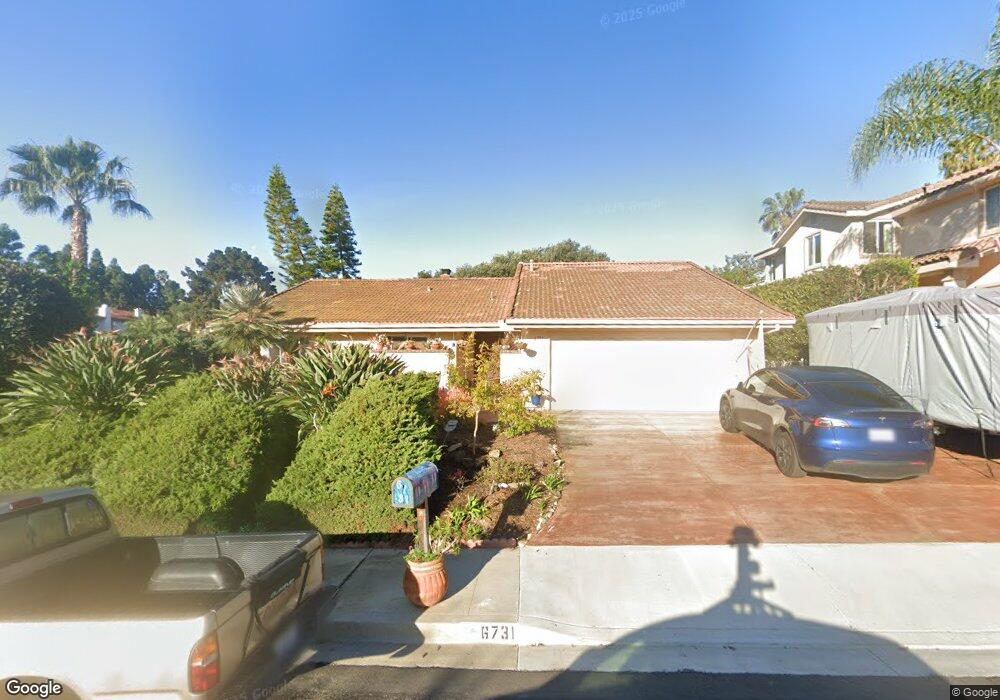
6731 Antilope St Carlsbad, CA 92009
La Costa NeighborhoodEstimated Value: $1,470,000 - $1,943,000
3
Beds
2
Baths
1,907
Sq Ft
$866/Sq Ft
Est. Value
About This Home
This home is located at 6731 Antilope St, Carlsbad, CA 92009 and is currently estimated at $1,650,577, approximately $865 per square foot. 6731 Antilope St is a home located in San Diego County with nearby schools including La Costa Meadows Elementary, San Elijo Middle School, and San Marcos High School.
Ownership History
Date
Name
Owned For
Owner Type
Purchase Details
Closed on
Oct 25, 2004
Sold by
Simes Leonard D and Simes Connie D
Bought by
Simes L D and Simes Connie D
Current Estimated Value
Purchase Details
Closed on
Jan 27, 1997
Sold by
Myers Jay C & Lisa
Bought by
Simes Leonard D and Simes Connie D
Home Financials for this Owner
Home Financials are based on the most recent Mortgage that was taken out on this home.
Original Mortgage
$180,800
Interest Rate
7.63%
Purchase Details
Closed on
Aug 9, 1996
Sold by
Myers Lisa
Bought by
Myers Jay C and Myers Lisa
Home Financials for this Owner
Home Financials are based on the most recent Mortgage that was taken out on this home.
Original Mortgage
$180,000
Interest Rate
8.42%
Purchase Details
Closed on
Oct 2, 1995
Sold by
Myers Jay C and Myers Lisa
Bought by
Myers Lisa
Purchase Details
Closed on
Sep 29, 1995
Sold by
Myers Jay C and Myers Lisa
Bought by
Myers Lisa
Purchase Details
Closed on
Jun 10, 1983
Create a Home Valuation Report for This Property
The Home Valuation Report is an in-depth analysis detailing your home's value as well as a comparison with similar homes in the area
Home Values in the Area
Average Home Value in this Area
Purchase History
| Date | Buyer | Sale Price | Title Company |
|---|---|---|---|
| Simes L D | -- | -- | |
| Simes Leonard D | $226,000 | First American Title | |
| Myers Jay C | -- | First American Title | |
| Myers Lisa | -- | -- | |
| Myers Lisa | -- | -- | |
| -- | $130,000 | -- |
Source: Public Records
Mortgage History
| Date | Status | Borrower | Loan Amount |
|---|---|---|---|
| Previous Owner | Simes Leonard D | $180,800 | |
| Previous Owner | Myers Jay C | $180,000 |
Source: Public Records
Tax History Compared to Growth
Tax History
| Year | Tax Paid | Tax Assessment Tax Assessment Total Assessment is a certain percentage of the fair market value that is determined by local assessors to be the total taxable value of land and additions on the property. | Land | Improvement |
|---|---|---|---|---|
| 2025 | $4,415 | $368,053 | $125,858 | $242,195 |
| 2024 | $4,415 | $360,838 | $123,391 | $237,447 |
| 2023 | $4,280 | $353,764 | $120,972 | $232,792 |
| 2022 | $4,173 | $346,828 | $118,600 | $228,228 |
| 2021 | $4,070 | $340,028 | $116,275 | $223,753 |
| 2020 | $4,007 | $336,542 | $115,083 | $221,459 |
| 2019 | $3,990 | $329,944 | $112,827 | $217,117 |
| 2018 | $3,899 | $323,475 | $110,615 | $212,860 |
| 2017 | $91 | $317,134 | $108,447 | $208,687 |
| 2016 | $3,768 | $310,917 | $106,321 | $204,596 |
| 2015 | $3,688 | $306,247 | $104,724 | $201,523 |
| 2014 | $3,582 | $300,249 | $102,673 | $197,576 |
Source: Public Records
Map
Nearby Homes
- 6712 Cantil St
- 2568 Abedul St
- 2515 Luciernaga St
- 6541 Vispera Place
- 6817 Vianda Ct
- 7146 Argonauta Way
- 7133 Obelisco Cir
- 6844 Urubu St
- 2610 Acuna Ct
- 6502 La Paloma St
- 7215 El Fuerte St
- 6977 Corte Langosta
- 2647 Marmol Ct
- 6911 Goldstone Rd
- 3519 Via Nido
- 7319 Bolero St
- 6839 Helenite Place
- 7394 Altiva Place
- 2318 Via Villegas
- 2364 Altisma Way Unit A
- 6725 Antilope St Unit 27
- 2636 Cazadero Dr Unit 38
- 2711 Abejorro St
- 6721 Antilope St Unit 23
- 6734 Antilope St
- 2630 Cazadero Dr
- 2709 Abejorro St
- 6730 Antilope St Unit U1
- 2717 Abejorro St
- 2715 Abejorro St
- 2721 Abejorro St
- 2721 Abejorro St
- 2642 Cazadero Dr
- 2640 Cazadero Dr
- 2721-23 Abejorro St
- 6726 Antilope St Unit 28
- 6717 Antilope St
- 2656 Cazadero Dr
- 2729 Abejorro St
- 2727 Abejorro St