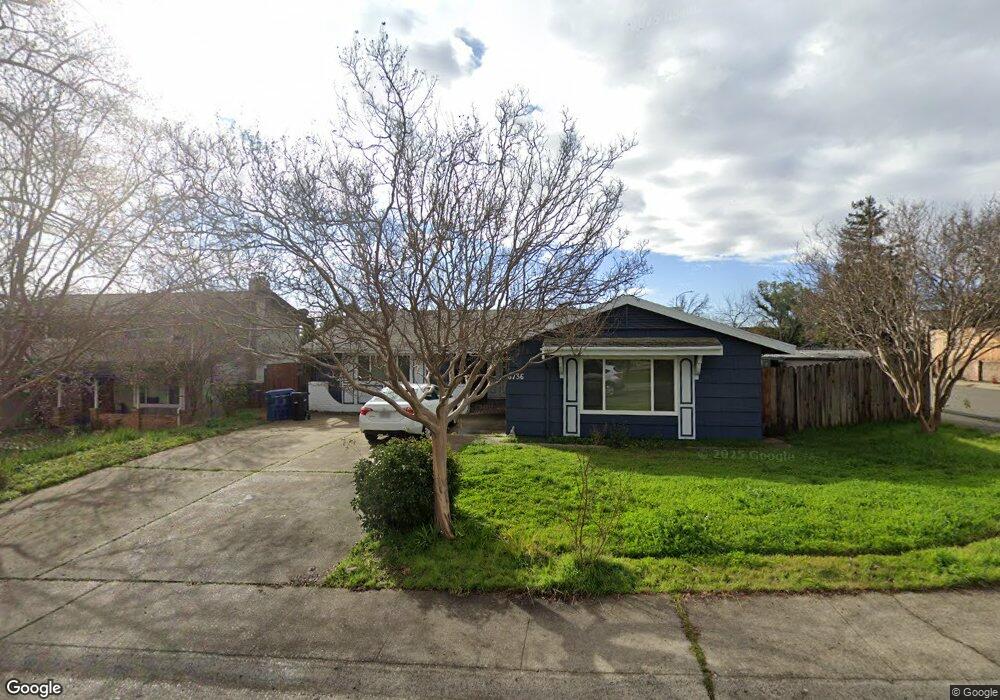
6736 Hillglen Way Fair Oaks, CA 95628
Estimated Value: $536,831 - $586,000
3
Beds
2
Baths
1,809
Sq Ft
$312/Sq Ft
Est. Value
About This Home
This home is located at 6736 Hillglen Way, Fair Oaks, CA 95628 and is currently estimated at $564,708, approximately $312 per square foot. 6736 Hillglen Way is a home located in Sacramento County with nearby schools including Charles Peck Elementary School, Will Rogers Middle School, and Del Campo High School.
Ownership History
Date
Name
Owned For
Owner Type
Purchase Details
Closed on
Jul 9, 2010
Sold by
Pather Gangamah and Pather Kulthamani
Bought by
Pather Kulthamani Cora and Pather Gangamah
Current Estimated Value
Purchase Details
Closed on
Aug 12, 2002
Sold by
Abreu Robert C and Slusser Carol J
Bought by
Pather Kulthamani and Pather Gangamah
Home Financials for this Owner
Home Financials are based on the most recent Mortgage that was taken out on this home.
Original Mortgage
$192,800
Outstanding Balance
$81,350
Interest Rate
6.51%
Estimated Equity
$483,358
Purchase Details
Closed on
Nov 22, 1996
Sold by
Jrp Properties Inc
Bought by
Abreu Robert C and Slusser Carol J
Home Financials for this Owner
Home Financials are based on the most recent Mortgage that was taken out on this home.
Original Mortgage
$133,575
Interest Rate
7.91%
Mortgage Type
VA
Purchase Details
Closed on
Aug 5, 1996
Sold by
Kunce Robert L and Miller Terri K
Bought by
Jrp Properties Inc
Create a Home Valuation Report for This Property
The Home Valuation Report is an in-depth analysis detailing your home's value as well as a comparison with similar homes in the area
Home Values in the Area
Average Home Value in this Area
Purchase History
| Date | Buyer | Sale Price | Title Company |
|---|---|---|---|
| Pather Kulthamani Cora | -- | None Available | |
| Pather Kulthamani | $241,000 | Financial Title Company | |
| Abreu Robert C | $130,000 | Stewart Title | |
| Jrp Properties Inc | $100,500 | First American Title |
Source: Public Records
Mortgage History
| Date | Status | Borrower | Loan Amount |
|---|---|---|---|
| Open | Pather Kulthamani | $192,800 | |
| Previous Owner | Abreu Robert C | $133,575 |
Source: Public Records
Tax History Compared to Growth
Tax History
| Year | Tax Paid | Tax Assessment Tax Assessment Total Assessment is a certain percentage of the fair market value that is determined by local assessors to be the total taxable value of land and additions on the property. | Land | Improvement |
|---|---|---|---|---|
| 2025 | $4,154 | $349,026 | $76,025 | $273,001 |
| 2024 | $4,154 | $342,184 | $74,535 | $267,649 |
| 2023 | $4,089 | $335,475 | $73,074 | $262,401 |
| 2022 | $4,008 | $328,898 | $71,642 | $257,256 |
| 2021 | $3,942 | $322,450 | $70,238 | $252,212 |
| 2020 | $3,868 | $319,144 | $69,518 | $249,626 |
| 2019 | $3,791 | $312,887 | $68,155 | $244,732 |
| 2018 | $3,747 | $306,753 | $66,819 | $239,934 |
| 2017 | $3,711 | $300,739 | $65,509 | $235,230 |
| 2016 | $3,467 | $294,843 | $64,225 | $230,618 |
| 2015 | $3,296 | $276,891 | $60,315 | $216,576 |
| 2014 | $3,138 | $263,706 | $57,443 | $206,263 |
Source: Public Records
Map
Nearby Homes
- 6716 Oaklawn Way
- 6744 Will Rogers Dr
- 6704 Oaklawn Way
- 7072 Cardinal Rd
- 5021 Waterbury Way
- 6636 Saint James Dr
- 5061 Dewey Dr
- 7012 Robin Rd
- 4722 Papaya Dr
- 4836 Rockland Way
- 7201 Cardinal Rd
- 5330 Sable Wood Ln
- 5213 Dove Dr
- 5329 Aldorae St
- 5250 Sonora Way
- 7125 Gail Way
- 6705 Palmtree Ct
- 5437 Elsinore Way
- 4943 Westerberg Way
- 6430 Sandstone St
- 6740 Hillglen Way
- 6744 Oaklawn Way
- 6732 Hillglen Way
- 6800 Oaklawn Way
- 6744 Hillglen Way
- 4913 Hillhurst Dr
- 6737 Oaklawn Way
- 6740 Oaklawn Way
- 4921 Hillhurst Dr
- 6728 Hillglen Way
- 6733 Hillglen Way
- 4909 Hillhurst Dr
- 6804 Oaklawn Way
- 6731 Oaklawn Way
- 6736 Oaklawn Way
- 6729 Hillglen Way
- 4925 Hillhurst Dr
- 4905 Hillhurst Dr
- 6724 Hillglen Way
- 6732 Oaklawn Way