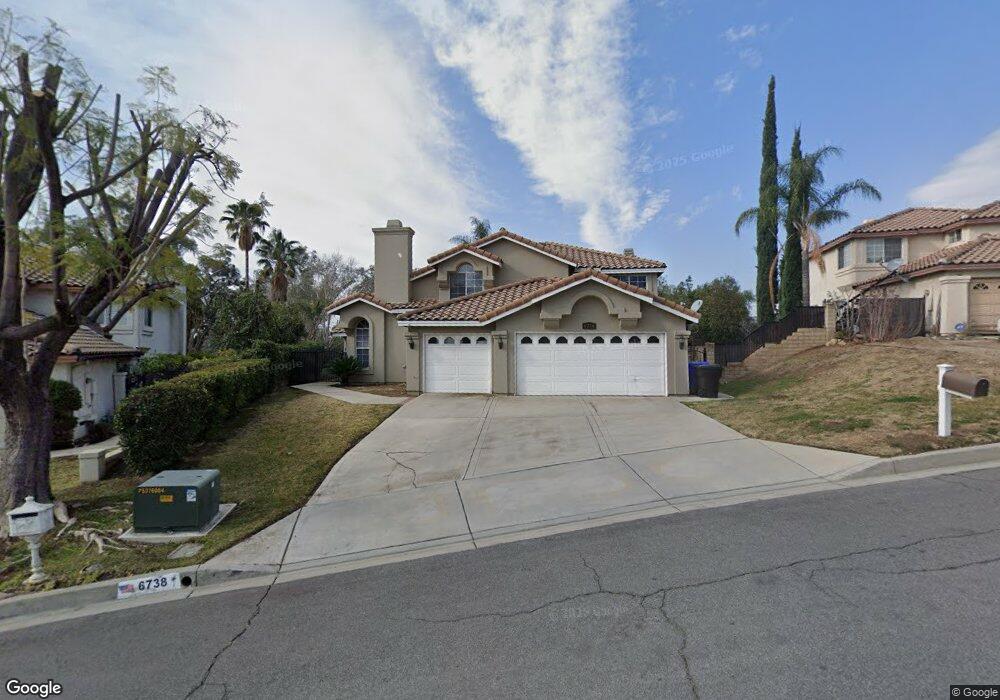
6738 Mountain Laurel Ct Highland, CA 92346
East Highlands NeighborhoodEstimated Value: $769,000 - $787,000
4
Beds
4
Baths
2,652
Sq Ft
$294/Sq Ft
Est. Value
About This Home
This home is located at 6738 Mountain Laurel Ct, Highland, CA 92346 and is currently estimated at $780,231, approximately $294 per square foot. 6738 Mountain Laurel Ct is a home located in San Bernardino County with nearby schools including Highland Grove Elementary School, Beattie Middle School, and Citrus Valley High School.
Ownership History
Date
Name
Owned For
Owner Type
Purchase Details
Closed on
Jul 31, 2019
Sold by
Tiliman John M
Bought by
Tiliman John M
Current Estimated Value
Home Financials for this Owner
Home Financials are based on the most recent Mortgage that was taken out on this home.
Original Mortgage
$130,000
Outstanding Balance
$113,926
Interest Rate
3.73%
Mortgage Type
New Conventional
Estimated Equity
$666,305
Purchase Details
Closed on
Feb 1, 2011
Sold by
Tillman John M
Bought by
Tillman John M
Purchase Details
Closed on
Oct 25, 2002
Sold by
Tillman John M
Bought by
Tillman John M and Tillman Chantia R
Home Financials for this Owner
Home Financials are based on the most recent Mortgage that was taken out on this home.
Original Mortgage
$278,400
Interest Rate
5.99%
Purchase Details
Closed on
Nov 30, 2000
Sold by
Delapena Victor E
Bought by
Tillman John M and Tillman Chantia
Home Financials for this Owner
Home Financials are based on the most recent Mortgage that was taken out on this home.
Original Mortgage
$261,000
Interest Rate
7.15%
Create a Home Valuation Report for This Property
The Home Valuation Report is an in-depth analysis detailing your home's value as well as a comparison with similar homes in the area
Home Values in the Area
Average Home Value in this Area
Purchase History
| Date | Buyer | Sale Price | Title Company |
|---|---|---|---|
| Tiliman John M | -- | Ticor Title Company | |
| Tillman John M | -- | None Available | |
| Tillman John M | -- | Fidelity National Title | |
| Tillman John M | $290,000 | Old Republic Title Company |
Source: Public Records
Mortgage History
| Date | Status | Borrower | Loan Amount |
|---|---|---|---|
| Open | Tiliman John M | $130,000 | |
| Closed | Tillman John M | $278,400 | |
| Previous Owner | Tillman John M | $261,000 |
Source: Public Records
Tax History Compared to Growth
Tax History
| Year | Tax Paid | Tax Assessment Tax Assessment Total Assessment is a certain percentage of the fair market value that is determined by local assessors to be the total taxable value of land and additions on the property. | Land | Improvement |
|---|---|---|---|---|
| 2025 | $5,406 | $436,989 | $109,248 | $327,741 |
| 2024 | $5,406 | $428,421 | $107,106 | $321,315 |
| 2023 | $5,399 | $420,021 | $105,006 | $315,015 |
| 2022 | $5,317 | $411,785 | $102,947 | $308,838 |
| 2021 | $5,362 | $403,710 | $100,928 | $302,782 |
| 2020 | $5,270 | $399,570 | $99,893 | $299,677 |
| 2019 | $5,111 | $391,735 | $97,934 | $293,801 |
| 2018 | $4,922 | $384,054 | $96,014 | $288,040 |
| 2017 | $4,629 | $376,523 | $94,131 | $282,392 |
| 2016 | $4,575 | $369,140 | $92,285 | $276,855 |
| 2015 | $4,540 | $363,595 | $90,899 | $272,696 |
| 2014 | $4,457 | $356,472 | $89,118 | $267,354 |
Source: Public Records
Map
Nearby Homes
- 28817 Terrace Dr
- 0 Gala St
- 28780 Beattie St
- 29029 Easton Ln
- 29045 Horner Ln
- 6508 Emmerton Ln
- 6497 Emmerton Ln
- 28947 Glenrock Place
- 7126 Ridge Dr
- 0 Cloverhill Dr
- 6858 Bacon Ln
- 28370 Coachman Ln
- 29301 Henderson Ln
- 29367 Lytle Ln
- 7214 Quail Run Dr
- 7354 Harding Ct
- 7184 Veranda Ln
- 29340 Crest View Ln
- 7188 Veranda Ln
- 7192 Veranda Ln
- 6752 Mountain Laurel Ct
- 6724 Mountain Laurel Ct
- 6741 Mountain Laurel Ct
- 6764 Mountain Laurel Ct
- 6710 Mountain Laurel Ct
- 6723 Mountain Laurel Ct
- 6704 Orangewood Rd
- 6763 Mountain Laurel Ct
- 6776 Mountain Laurel Ct
- 28853 Orangewood Rd
- 6702 Orangewood Rd
- 6788 Mountain Laurel Ct
- 28828 Orangewood Rd
- 28814 Orangewood Rd
- 6698 Orangewood Rd
- 6699 Orangewood Rd
- 6732 Church St
- 6758 Church St
- 28766 Oak Ridge Rd
- 28746 Oak Ridge Rd