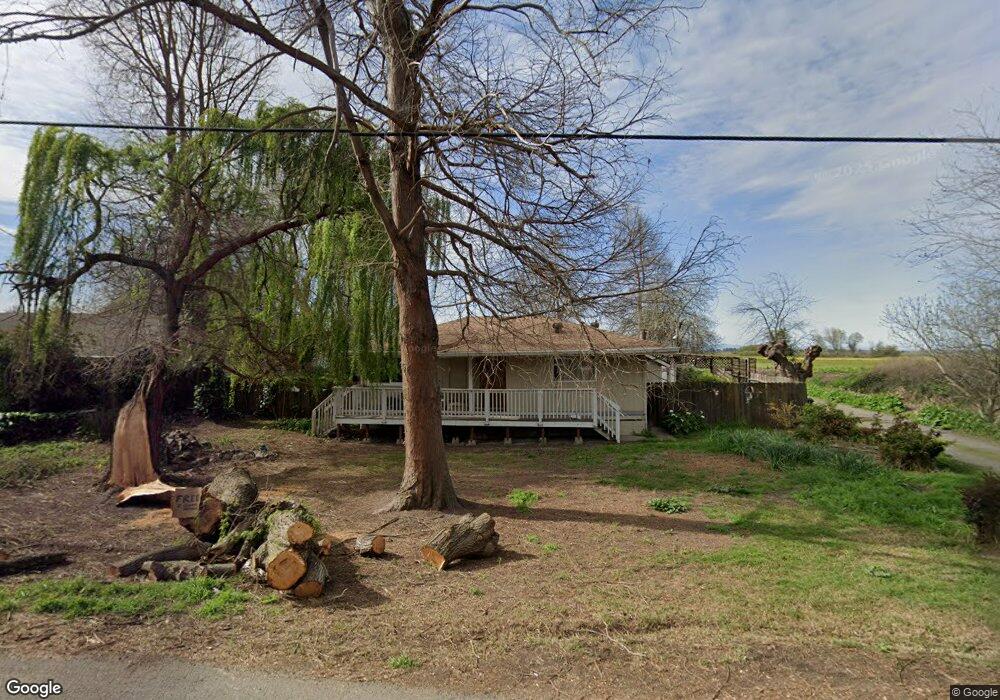
674 W Tyler Island Bridge Rd Isleton, CA 95641
Estimated Value: $253,000 - $414,000
2
Beds
1
Bath
920
Sq Ft
$358/Sq Ft
Est. Value
About This Home
This home is located at 674 W Tyler Island Bridge Rd, Isleton, CA 95641 and is currently estimated at $329,370, approximately $358 per square foot. 674 W Tyler Island Bridge Rd is a home located in Sacramento County with nearby schools including Isleton Elementary School, Riverview Middle School, and Rio Vista High School.
Ownership History
Date
Name
Owned For
Owner Type
Purchase Details
Closed on
Oct 10, 2008
Sold by
Hsbc Mortgage Services Inc
Bought by
Cline Pamela A and Cline Ronald B
Current Estimated Value
Home Financials for this Owner
Home Financials are based on the most recent Mortgage that was taken out on this home.
Original Mortgage
$93,575
Outstanding Balance
$60,220
Interest Rate
5.77%
Mortgage Type
Purchase Money Mortgage
Estimated Equity
$269,150
Purchase Details
Closed on
Jul 8, 2008
Sold by
Jackson Kathleen Ann and Jackson Charles Eugene
Bought by
Hsbc Mortgage Services Inc
Purchase Details
Closed on
Dec 17, 2003
Sold by
Jackson Kathleen Ann and Jackson Charles Eugene
Bought by
Jackson Charles Eugene and Jackson Kathleen Ann
Home Financials for this Owner
Home Financials are based on the most recent Mortgage that was taken out on this home.
Original Mortgage
$168,000
Interest Rate
8.5%
Mortgage Type
New Conventional
Create a Home Valuation Report for This Property
The Home Valuation Report is an in-depth analysis detailing your home's value as well as a comparison with similar homes in the area
Home Values in the Area
Average Home Value in this Area
Purchase History
| Date | Buyer | Sale Price | Title Company |
|---|---|---|---|
| Cline Pamela A | $98,500 | Fidelity National Title Co | |
| Hsbc Mortgage Services Inc | $192,005 | None Available | |
| Jackson Charles Eugene | -- | Financial Title Company |
Source: Public Records
Mortgage History
| Date | Status | Borrower | Loan Amount |
|---|---|---|---|
| Open | Cline Pamela A | $93,575 | |
| Previous Owner | Jackson Charles Eugene | $168,000 |
Source: Public Records
Tax History Compared to Growth
Tax History
| Year | Tax Paid | Tax Assessment Tax Assessment Total Assessment is a certain percentage of the fair market value that is determined by local assessors to be the total taxable value of land and additions on the property. | Land | Improvement |
|---|---|---|---|---|
| 2025 | $1,627 | $126,828 | $87,558 | $39,270 |
| 2024 | $1,627 | $124,342 | $85,842 | $38,500 |
| 2023 | $1,596 | $121,905 | $84,159 | $37,746 |
| 2022 | $1,570 | $119,515 | $82,509 | $37,006 |
| 2021 | $1,436 | $117,173 | $80,892 | $36,281 |
| 2020 | $1,383 | $115,972 | $80,063 | $35,909 |
| 2019 | $1,336 | $113,699 | $78,494 | $35,205 |
| 2018 | $1,361 | $111,470 | $76,955 | $34,515 |
| 2017 | $1,214 | $109,286 | $75,447 | $33,839 |
| 2016 | $1,194 | $107,144 | $73,968 | $33,176 |
| 2015 | $1,194 | $105,535 | $72,857 | $32,678 |
| 2014 | $1,183 | $103,468 | $71,430 | $32,038 |
Source: Public Records
Map
Nearby Homes
- 665 W Tyler Island Bridge Rd
- 633 W Tyler Island Bridge Rd
- 320-B B St
- 16637 Tyler Island Rd
- 706 Anne Marie Way
- 702 Annemarie Way
- 58 Main St
- 0 6th St
- 0 6th St
- 39 Main St
- 612 Union St
- 608 Union St
- 16550 California 160
- 195 Oxbow Marina Dr
- 10 School St
- 301 B St
- 209 4th St
- 00 Brannan Isle Rd
- 104 4th St
- 303 Delta Ave
- 668 W Tyler Island Bridge Rd
- 664 W Tyler Island Bridge Rd
- 660 W Tyler Island Bridge Rd
- 667 W Tyler Island Bridge Rd
- 675 W Tyler Island Bridge Rd
- 654 W Tyler Island Bridge Rd
- 681 W Tyler Island Bridge Rd
- 659 W Tyler Island Bridge Rd
- 687 W Tyler Island Bridge Rd
- 694 W Tyler Island Bridge Rd
- 644 Tyler Is Br Rd
- 693 W Tyler Island Bridge Rd
- 691 W Tyler Island Bridge Rd
- 698 W Tyler Island Bridge Rd
- 636 W Tyler Island Bridge Rd
- 700 W Tyler Island Bridge Rd
- 641 Tyler Island Bridge Rd
- 628 W Tyler Island Bridge Rd
- 708 Tyler Is Br Rd