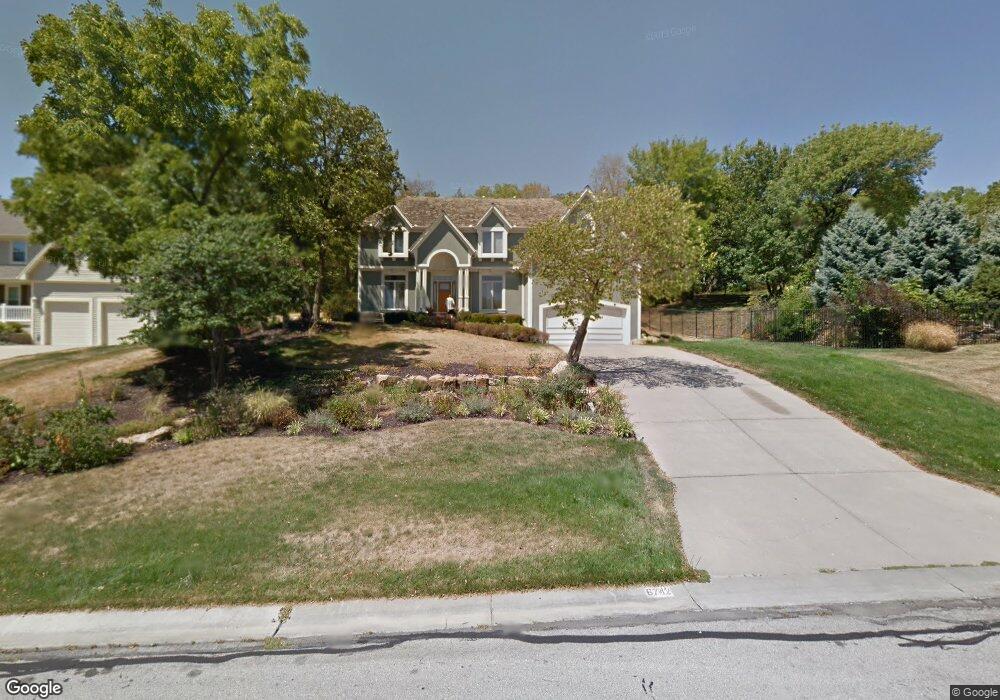
6742 Red Oak Dr Shawnee, KS 66217
Estimated Value: $554,000 - $592,000
4
Beds
4
Baths
3,400
Sq Ft
$168/Sq Ft
Est. Value
About This Home
This home is located at 6742 Red Oak Dr, Shawnee, KS 66217 and is currently estimated at $572,608, approximately $168 per square foot. 6742 Red Oak Dr is a home located in Johnson County with nearby schools including Lenexa Hills Elementary School, Trailridge Middle School, and Shawnee Mission Northwest High School.
Ownership History
Date
Name
Owned For
Owner Type
Purchase Details
Closed on
Apr 11, 2003
Sold by
Hudok Kenneth T and Hudok Tiffany
Bought by
Ransom Thomas B and Ransom Dianne E
Current Estimated Value
Home Financials for this Owner
Home Financials are based on the most recent Mortgage that was taken out on this home.
Original Mortgage
$175,000
Outstanding Balance
$74,571
Interest Rate
5.64%
Estimated Equity
$498,037
Purchase Details
Closed on
Feb 13, 2001
Sold by
Buscher Scott C
Bought by
Hudok Kenneth T and Hudok Tiffany
Home Financials for this Owner
Home Financials are based on the most recent Mortgage that was taken out on this home.
Original Mortgage
$233,600
Interest Rate
7.04%
Purchase Details
Closed on
Dec 14, 2000
Sold by
Buscher Tamara A
Bought by
Buscher Scott C
Create a Home Valuation Report for This Property
The Home Valuation Report is an in-depth analysis detailing your home's value as well as a comparison with similar homes in the area
Home Values in the Area
Average Home Value in this Area
Purchase History
| Date | Buyer | Sale Price | Title Company |
|---|---|---|---|
| Ransom Thomas B | -- | Chicago Title Insurance Co | |
| Hudok Kenneth T | -- | Old Republic Natl Title Ins | |
| Buscher Scott C | -- | -- |
Source: Public Records
Mortgage History
| Date | Status | Borrower | Loan Amount |
|---|---|---|---|
| Open | Ransom Thomas B | $175,000 | |
| Previous Owner | Hudok Kenneth T | $233,600 | |
| Closed | Ransom Thomas B | $125,600 |
Source: Public Records
Tax History
| Year | Tax Paid | Tax Assessment Tax Assessment Total Assessment is a certain percentage of the fair market value that is determined by local assessors to be the total taxable value of land and additions on the property. | Land | Improvement |
|---|---|---|---|---|
| 2024 | $6,178 | $57,960 | $10,787 | $47,173 |
| 2023 | $5,999 | $55,844 | $9,803 | $46,041 |
| 2022 | $5,726 | $53,130 | $9,803 | $43,327 |
| 2021 | $5,304 | $46,357 | $9,803 | $36,554 |
| 2020 | $5,175 | $47,334 | $8,525 | $38,809 |
| 2019 | $5,241 | $45,195 | $7,744 | $37,451 |
| 2018 | $5,314 | $45,655 | $7,744 | $37,911 |
| 2017 | $4,989 | $42,193 | $6,740 | $35,453 |
| 2016 | $5,052 | $42,193 | $6,740 | $35,453 |
| 2015 | $4,659 | $40,192 | $6,741 | $33,451 |
| 2013 | -- | $37,030 | $6,741 | $30,289 |
Source: Public Records
Map
Nearby Homes
- 17802 W 69th St
- 6732 Clairborne Rd
- 19403 W 64th Terrace
- 6040 Renner Rd
- 5810 Locust St
- 5750 Locust St
- 7229 Allman Dr
- 7239 Allman Rd
- 7221 Allman Rd
- 7237 Allman Rd
- 7231 Allman Rd
- 6942 Constance St
- 15517 W 168th Terrace
- 6753 Longview Rd
- 6764 Longview Rd
- 14512 W 69th St
- 14512 W 69th Terrace
- 14406 W 65th Terrace
- 6820 Marion St
- 580 Lakeshore Dr W
- 6746 Red Oak Dr
- 6750 Red Oak Dr
- 6734 Red Oak Dr
- 6754 Red Oak Dr
- 18000 W 68th St
- 6743 Red Oak Dr
- 6730 Red Oak Dr
- 6747 Red Oak Dr
- 6751 Red Oak Dr
- 6731 Red Oak Dr
- 6726 Red Oak Dr
- 17814 W 68th St
- 17808 W 68th St
- 17820 W 68th St
- 6755 Red Oak Dr
- 17709 W 67th Terrace
- 6725 Red Oak Dr
- 17712 W 67th Terrace
- 6722 Red Oak Dr