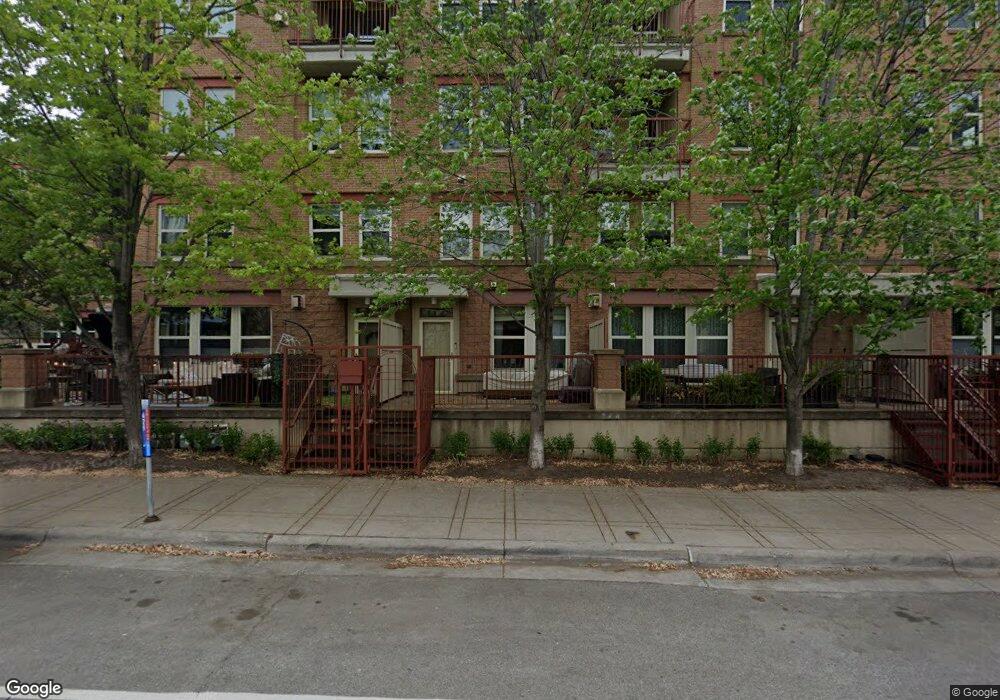
675 N 1st St Unit 103 Minneapolis, MN 55401
North Loop NeighborhoodEstimated Value: $302,891 - $383,000
1
Bed
2
Baths
1,032
Sq Ft
$320/Sq Ft
Est. Value
About This Home
This home is located at 675 N 1st St Unit 103, Minneapolis, MN 55401 and is currently estimated at $330,723, approximately $320 per square foot. 675 N 1st St Unit 103 is a home located in Hennepin County with nearby schools including Webster Elementary, Northeast Middle School, and Thomas Edison High School.
Ownership History
Date
Name
Owned For
Owner Type
Purchase Details
Closed on
Oct 5, 2020
Sold by
Hassenauer Austin M and Hassenauer Tracy K
Bought by
Backes Kristina
Current Estimated Value
Purchase Details
Closed on
Nov 29, 2018
Sold by
Poklar Mark
Bought by
Hassenauer Austin M and Hassenauer Tracy K
Home Financials for this Owner
Home Financials are based on the most recent Mortgage that was taken out on this home.
Original Mortgage
$270,750
Interest Rate
4.8%
Mortgage Type
New Conventional
Purchase Details
Closed on
May 14, 2014
Sold by
Guan Charles
Bought by
Poklar Mark
Purchase Details
Closed on
Mar 27, 2009
Sold by
Kjelsberg Ann E
Bought by
Guan Charlie
Purchase Details
Closed on
Jan 28, 2002
Sold by
Sperle Kevin F
Bought by
Kjelsberg Ann E
Purchase Details
Closed on
Jun 30, 2000
Sold by
Heritage Renovations Llc
Bought by
Sperle Kevin F
Purchase Details
Closed on
Aug 14, 1998
Sold by
Heritage Renovations Llc
Bought by
Enger Ronald L and Enger Dianne M
Create a Home Valuation Report for This Property
The Home Valuation Report is an in-depth analysis detailing your home's value as well as a comparison with similar homes in the area
Home Values in the Area
Average Home Value in this Area
Purchase History
| Date | Buyer | Sale Price | Title Company |
|---|---|---|---|
| Backes Kristina | $300,000 | Results Title | |
| Hassenauer Austin M | $285,000 | None Available | |
| Poklar Mark | $210,000 | Watermark Title Agency | |
| Guan Charlie | $185,000 | -- | |
| Kjelsberg Ann E | $198,000 | -- | |
| Sperle Kevin F | $148,225 | -- | |
| Enger Ronald L | $150,083 | -- | |
| Backes Kristina Kristina | $300,000 | -- |
Source: Public Records
Mortgage History
| Date | Status | Borrower | Loan Amount |
|---|---|---|---|
| Previous Owner | Hassenauer Austin M | $270,750 |
Source: Public Records
Tax History Compared to Growth
Tax History
| Year | Tax Paid | Tax Assessment Tax Assessment Total Assessment is a certain percentage of the fair market value that is determined by local assessors to be the total taxable value of land and additions on the property. | Land | Improvement |
|---|---|---|---|---|
| 2024 | $4,279 | $305,000 | $89,000 | $216,000 |
| 2023 | $3,851 | $304,000 | $89,000 | $215,000 |
| 2022 | $4,046 | $295,000 | $80,000 | $215,000 |
| 2021 | $3,733 | $295,000 | $72,000 | $223,000 |
| 2020 | $4,046 | $289,000 | $43,400 | $245,600 |
| 2019 | $3,865 | $289,000 | $21,700 | $267,300 |
| 2018 | $3,601 | $270,000 | $21,700 | $248,300 |
| 2017 | $3,362 | $232,500 | $21,700 | $210,800 |
| 2016 | $3,191 | $216,000 | $21,700 | $194,300 |
| 2015 | $2,928 | $192,500 | $21,700 | $170,800 |
| 2014 | -- | $165,500 | $21,700 | $143,800 |
Source: Public Records
Map
Nearby Homes
- 660 N 2nd St Unit 303
- 680 N 2nd St Unit 403
- 645 N 1st St Unit 305
- 645 N 1st St Unit 125
- 716 N 1st St Unit 536
- 580 N 2nd St Unit 300
- 560 N 2nd St Unit 410
- 560 N 2nd St Unit 114
- 618 Washington Ave N Unit 304
- 718 Washington Ave N Unit 612
- 718 Washington Ave N Unit 602
- 700 Washington Ave N Unit 523
- 700 Washington Ave N Unit 627
- 700 Washington Ave N Unit 507
- 700 Washington Ave N Unit 207
- 700 Washington Ave N Unit 615
- 545 N 1st St Unit 125
- 545 N 1st St Unit 123
- 545 N 1st St Unit 411
- 517 River St
- 675 N 1st St Unit 407
- 675 N 1st St Unit 405
- 675 N 1st St Unit 404
- 675 N 1st St Unit 403
- 675 N 1st St Unit 402
- 675 N 1st St Unit 401
- 675 N 1st St Unit 400
- 675 N 1st St Unit 304
- 675 N 1st St Unit 303
- 675 N 1st St Unit 302
- 675 N 1st St Unit 301
- 675 N 1st St Unit 121
- 675 N 1st St Unit 119
- 675 N 1st St Unit 117
- 675 N 1st St Unit 115
- 675 N 1st St Unit 111
- 675 N 1st St Unit 109
- 675 N 1st St Unit 107
- 675 N 1st St Unit 105
- 675 N 1st St Unit 101