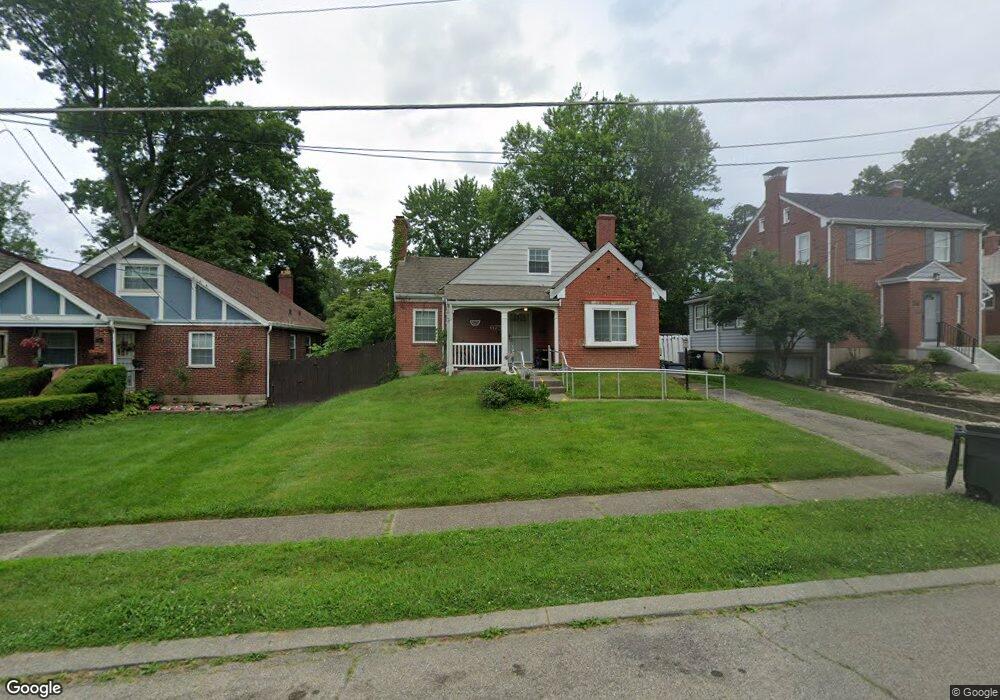
6753 Siebern Ave Cincinnati, OH 45236
Estimated Value: $242,000 - $320,000
3
Beds
2
Baths
1,517
Sq Ft
$179/Sq Ft
Est. Value
About This Home
This home is located at 6753 Siebern Ave, Cincinnati, OH 45236 and is currently estimated at $271,349, approximately $178 per square foot. 6753 Siebern Ave is a home located in Hamilton County with nearby schools including Pleasant Ridge Montessori School, Shroder High School, and Clark Montessori High School.
Ownership History
Date
Name
Owned For
Owner Type
Purchase Details
Closed on
Feb 9, 2006
Sold by
Hud
Bought by
Lovett Nakya
Current Estimated Value
Home Financials for this Owner
Home Financials are based on the most recent Mortgage that was taken out on this home.
Original Mortgage
$70,800
Outstanding Balance
$46,844
Interest Rate
9.8%
Mortgage Type
Unknown
Estimated Equity
$224,505
Purchase Details
Closed on
May 9, 2005
Sold by
Craig Tyrone J and Craig Jeannine M
Bought by
Hud
Purchase Details
Closed on
Oct 31, 1994
Sold by
Booth Yvette E Livers
Bought by
Craig Tyrone J and Craig Jeannine M
Home Financials for this Owner
Home Financials are based on the most recent Mortgage that was taken out on this home.
Original Mortgage
$75,600
Interest Rate
8.75%
Mortgage Type
FHA
Purchase Details
Closed on
Jan 24, 1994
Sold by
Booth Venchael
Bought by
Livers Yvette E
Home Financials for this Owner
Home Financials are based on the most recent Mortgage that was taken out on this home.
Original Mortgage
$51,500
Interest Rate
7.26%
Create a Home Valuation Report for This Property
The Home Valuation Report is an in-depth analysis detailing your home's value as well as a comparison with similar homes in the area
Home Values in the Area
Average Home Value in this Area
Purchase History
| Date | Buyer | Sale Price | Title Company |
|---|---|---|---|
| Lovett Nakya | $88,500 | Lakeside Title & Escrow Agen | |
| Hud | $80,000 | None Available | |
| Craig Tyrone J | -- | -- | |
| Livers Yvette E | -- | -- |
Source: Public Records
Mortgage History
| Date | Status | Borrower | Loan Amount |
|---|---|---|---|
| Open | Lovett Nakya | $70,800 | |
| Previous Owner | Craig Tyrone J | $75,600 | |
| Previous Owner | Livers Yvette E | $51,500 |
Source: Public Records
Tax History
| Year | Tax Paid | Tax Assessment Tax Assessment Total Assessment is a certain percentage of the fair market value that is determined by local assessors to be the total taxable value of land and additions on the property. | Land | Improvement |
|---|---|---|---|---|
| 2025 | $3,516 | $56,350 | $10,668 | $45,682 |
| 2023 | $3,291 | $56,350 | $10,668 | $45,682 |
| 2022 | $3,133 | $45,406 | $8,988 | $36,418 |
| 2021 | $3,051 | $45,406 | $8,988 | $36,418 |
| 2020 | $3,100 | $45,406 | $8,988 | $36,418 |
| 2019 | $3,020 | $39,831 | $7,886 | $31,945 |
| 2018 | $3,025 | $39,831 | $7,886 | $31,945 |
| 2017 | $2,889 | $39,831 | $7,886 | $31,945 |
| 2016 | $3,075 | $41,619 | $8,596 | $33,023 |
| 2015 | $2,781 | $41,619 | $8,596 | $33,023 |
| 2014 | $2,799 | $41,619 | $8,596 | $33,023 |
| 2013 | $2,611 | $38,182 | $7,886 | $30,296 |
Source: Public Records
Map
Nearby Homes
- 3566 Amberacres Dr
- 6829 Alpine Ave
- 6460 Mchugh Place
- 3521 Section Rd
- 6501 Coleridge Ave
- 4025 Deer Park Ave
- 3708 Zinsle Ave
- 6656 Plainfield Rd
- 6454 Crestview Ave
- 6470 Crestview Ave
- 6240 Red Bank Rd
- 6466 Crestview Ave
- 6462 Crestview Ave
- 6458 Crestview Ave
- 6577 Plainfield Rd
- 3625 Zinsle Ave
- 3824 Standish Ave
- 6705 Elwynne Dr
- 3523 Mary Ann Ln
- 6221 Hedge Ave
- 6747 Siebern Ave
- 6757 Siebern Ave
- 6761 Siebern Ave
- 6743 Siebern Ave
- 6756 Placid Place
- 6752 Placid Place
- 6765 Siebern Ave
- 6748 Placid Place
- 6739 Siebern Ave
- 6760 Placid Place
- 6744 Placid Place
- 6769 Siebern Ave
- 6750 Siebern Ave
- 6740 Placid Place
- 6746 Siebern Ave
- 6754 Siebern Ave
- 6737 Siebern Ave
- 6758 Siebern Ave
- 6744 Siebern Ave
- 6736 Placid Place
Your Personal Tour Guide
Ask me questions while you tour the home.