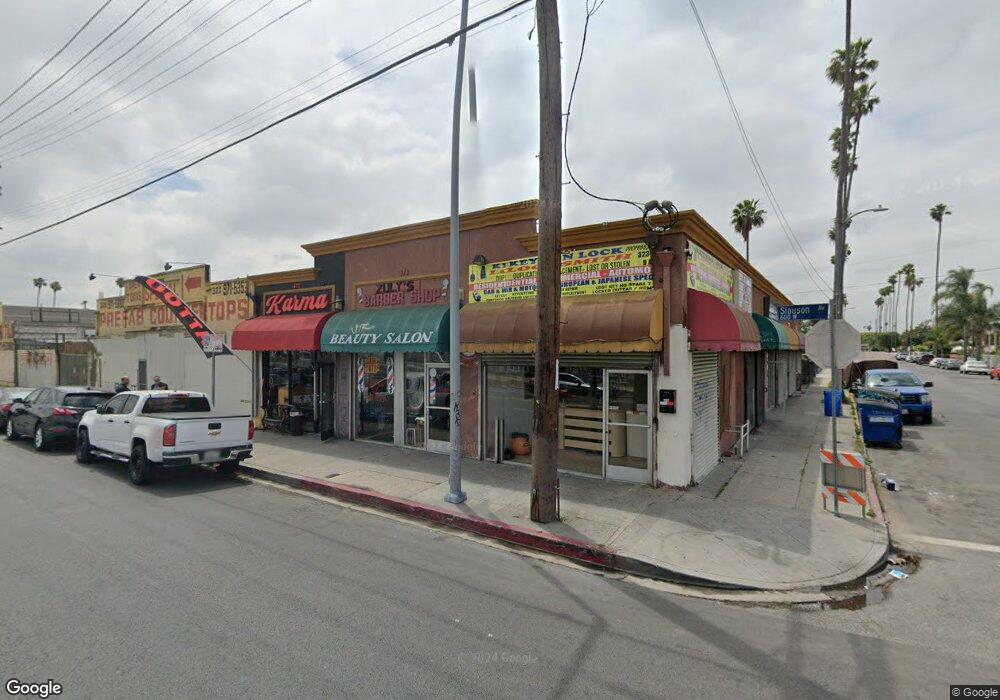
676 W Slauson Ave Los Angeles, CA 90044
Vermont-Slauson NeighborhoodEstimated Value: $1,956,210
--
Bed
--
Bath
4,860
Sq Ft
$403/Sq Ft
Est. Value
About This Home
This home is located at 676 W Slauson Ave, Los Angeles, CA 90044 and is currently priced at $1,956,210, approximately $402 per square foot. 676 W Slauson Ave is a home located in Los Angeles County with nearby schools including 61st Street Elementary School, John Muir Middle School, and Augustus F. Hawkins High A Critical Design And Gaming.
Ownership History
Date
Name
Owned For
Owner Type
Purchase Details
Closed on
Feb 21, 2025
Sold by
Farjam Firoozeh
Bought by
Gharakhanian-Ohanian Living Trust and Gharakhanian
Current Estimated Value
Purchase Details
Closed on
May 21, 2014
Sold by
Vip Group Investments Llc
Bought by
Farjam Firoozeh
Home Financials for this Owner
Home Financials are based on the most recent Mortgage that was taken out on this home.
Original Mortgage
$525,000
Interest Rate
4.12%
Mortgage Type
Commercial
Purchase Details
Closed on
Mar 30, 2006
Sold by
Bonded Investment Group Llc
Bought by
Vip Group Investment Llc
Home Financials for this Owner
Home Financials are based on the most recent Mortgage that was taken out on this home.
Original Mortgage
$440,000
Interest Rate
6.25%
Mortgage Type
Commercial
Purchase Details
Closed on
Sep 3, 2004
Sold by
Rich Doris
Bought by
Bonded Investment Group Llc
Create a Home Valuation Report for This Property
The Home Valuation Report is an in-depth analysis detailing your home's value as well as a comparison with similar homes in the area
Home Values in the Area
Average Home Value in this Area
Purchase History
| Date | Buyer | Sale Price | Title Company |
|---|---|---|---|
| Gharakhanian-Ohanian Living Trust | $990,000 | Fidelity National Title | |
| Farjam Firoozeh | $1,052,000 | Usa National Title Co | |
| Vip Group Investment Llc | -- | United Title Company-La | |
| Bonded Investment Group Llc | $380,000 | -- |
Source: Public Records
Mortgage History
| Date | Status | Borrower | Loan Amount |
|---|---|---|---|
| Previous Owner | Farjam Firoozeh | $525,000 | |
| Previous Owner | Vip Group Investment Llc | $440,000 |
Source: Public Records
Tax History Compared to Growth
Tax History
| Year | Tax Paid | Tax Assessment Tax Assessment Total Assessment is a certain percentage of the fair market value that is determined by local assessors to be the total taxable value of land and additions on the property. | Land | Improvement |
|---|---|---|---|---|
| 2025 | $15,573 | $1,264,337 | $721,106 | $543,231 |
| 2024 | $15,573 | $1,239,547 | $706,967 | $532,580 |
| 2023 | $15,281 | $1,215,243 | $693,105 | $522,138 |
| 2022 | $14,587 | $1,191,415 | $679,515 | $511,900 |
| 2021 | $14,388 | $1,168,055 | $666,192 | $501,863 |
| 2019 | $13,965 | $1,133,413 | $646,434 | $486,979 |
| 2018 | $13,833 | $1,111,190 | $633,759 | $477,431 |
| 2016 | $13,199 | $1,068,043 | $609,150 | $458,893 |
| 2015 | $13,010 | $1,052,000 | $600,000 | $452,000 |
| 2014 | $7,962 | $613,130 | $390,175 | $222,955 |
Source: Public Records
Map
Nearby Homes
- 611 W 58th St
- 5879 Bonsallo Ave
- 5903 Bonsallo Ave
- 5914 S Hoover St
- 5926 S Hoover St
- 534 W 56th St Unit 3
- 529 W 56th St
- 430 W 58th St
- 437 W 58th St
- 614 W 60th St
- 731 W 54th St
- 717 W 54th St
- 621 W 54th St
- 421 W 55th St
- 5907 S Olive St
- 859 W 54th St
- 5840 S Olive St
- 840 W 53rd St
- 6111 Menlo Ave
- 505 W 62nd St
- 5834 Bonsallo Ave
- 5840 Bonsallo Ave
- 5842 Bonsallo Ave
- 5837 Estrella Ave
- 5839 Estrella Ave
- 5835 Bonsallo Ave
- 5846 Bonsallo Ave
- 5839 Bonsallo Ave
- 634 W 58th St
- 5841 Estrella Ave
- 5850 Bonsallo Ave
- 5843 Bonsallo Ave
- 712 W Slauson Ave
- 5845 Estrella Ave
- 5847 Bonsallo Ave
- 5854 Bonsallo Ave
- 5849 Estrella Ave
- 5851 Bonsallo Ave
- 5853 Estrella Ave
- 5860 Bonsallo Ave