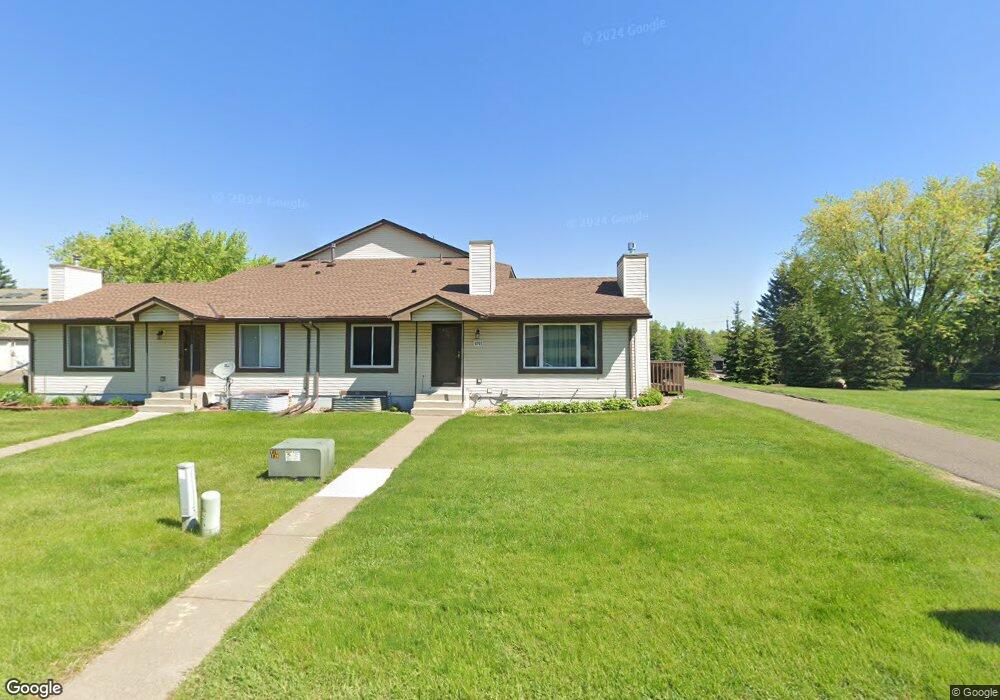
6761 Gretchen Ct N Saint Paul, MN 55128
Estimated Value: $246,000 - $287,000
3
Beds
3
Baths
1,311
Sq Ft
$208/Sq Ft
Est. Value
About This Home
This home is located at 6761 Gretchen Ct N, Saint Paul, MN 55128 and is currently estimated at $272,963, approximately $208 per square foot. 6761 Gretchen Ct N is a home located in Washington County with nearby schools including Castle Elementary School, Justice Alan Page Elementary, and John Glenn Middle School.
Ownership History
Date
Name
Owned For
Owner Type
Purchase Details
Closed on
Mar 20, 2018
Sold by
Thiele Richard and Nelson Thiele Monica
Bought by
Mcclain Ebone
Current Estimated Value
Home Financials for this Owner
Home Financials are based on the most recent Mortgage that was taken out on this home.
Original Mortgage
$181,649
Outstanding Balance
$156,070
Interest Rate
4.4%
Mortgage Type
Stand Alone First
Estimated Equity
$116,893
Purchase Details
Closed on
Oct 13, 2015
Sold by
Mishler Brian J and Mishler Tracey L
Bought by
Thiele Richard and Nelson Thiele Monica
Home Financials for this Owner
Home Financials are based on the most recent Mortgage that was taken out on this home.
Original Mortgage
$165,280
Interest Rate
3.88%
Mortgage Type
VA
Purchase Details
Closed on
Dec 31, 2002
Sold by
Woller Betty and Winterfeldt Christina
Bought by
Mishler Brian J and Peterson Tracy L
Create a Home Valuation Report for This Property
The Home Valuation Report is an in-depth analysis detailing your home's value as well as a comparison with similar homes in the area
Home Values in the Area
Average Home Value in this Area
Purchase History
| Date | Buyer | Sale Price | Title Company |
|---|---|---|---|
| Mcclain Ebone | $185,000 | Edgewater Title Group Llc | |
| Thiele Richard | $160,000 | Casterton Title & Closing Co | |
| Mishler Brian J | $164,000 | -- |
Source: Public Records
Mortgage History
| Date | Status | Borrower | Loan Amount |
|---|---|---|---|
| Open | Mcclain Ebone | $181,649 | |
| Closed | Mcclain Ebone | $181,649 | |
| Previous Owner | Thiele Richard | $165,280 |
Source: Public Records
Tax History Compared to Growth
Tax History
| Year | Tax Paid | Tax Assessment Tax Assessment Total Assessment is a certain percentage of the fair market value that is determined by local assessors to be the total taxable value of land and additions on the property. | Land | Improvement |
|---|---|---|---|---|
| 2024 | $2,782 | $256,000 | $35,000 | $221,000 |
| 2023 | $2,782 | $271,600 | $48,000 | $223,600 |
| 2022 | $2,548 | $253,900 | $48,000 | $205,900 |
| 2021 | $2,430 | $222,900 | $42,500 | $180,400 |
| 2020 | $2,378 | $213,100 | $42,000 | $171,100 |
| 2019 | $1,928 | $205,800 | $40,000 | $165,800 |
| 2018 | $2,506 | $172,500 | $32,500 | $140,000 |
| 2017 | $2,544 | $154,700 | $20,000 | $134,700 |
| 2016 | $1,720 | $150,600 | $20,000 | $130,600 |
| 2015 | $1,542 | $119,400 | $21,600 | $97,800 |
| 2013 | -- | $113,900 | $20,800 | $93,100 |
Source: Public Records
Map
Nearby Homes
- 3925 Gresham Cir N
- 6639 Gretchen Ln N
- 6631 Gretchen Ln N
- 3838 Goodwin Ave N
- 3592 Garden Blvd N
- 3945 Gershwin Ave N
- 6920 35th St N
- 3740 Gershwin Ave N
- 7516 Upper 42nd St N
- 7562 Upper 42nd St N
- 3597 Gershwin Ct N
- 3507 Goodwin Ave N
- 3662 Gershwin Ln N
- 4625 Hamlet Ave N
- 3590 Genevieve Ave N
- 4812 Grenwich Way N
- 4788 Grenwich Way N
- 4819 Grenwich Way N
- 3915 Helena Ave N
- 4843 Grenwich Way N
- 6754 Gretchen Place N
- 6767 Gretchen Ct N
- 6758 Gretchen Place N
- 6734 Gretchen Place N
- 6736 Gretchen Place N
- 6752 Gretchen Ct N
- 6748 Gretchen Ct N
- 6766 Gretchen Ct N
- 6727 Gretchen Ct N
- 6775 Gretchen Ln N
- 6729 Gretchen Ct N
- 6750 Gretchen Ct N
- 6762 Gretchen Ct N
- 3975 Gresham Ct N
- 6730 Gretchen Ct N
- 6771 Gretchen Ln N
- 6771 Gretchen Ln N Unit 6771
- 6725 Gretchen Ln N
- 6728 Gretchen Ct N
- 6720 Gretchen Place N