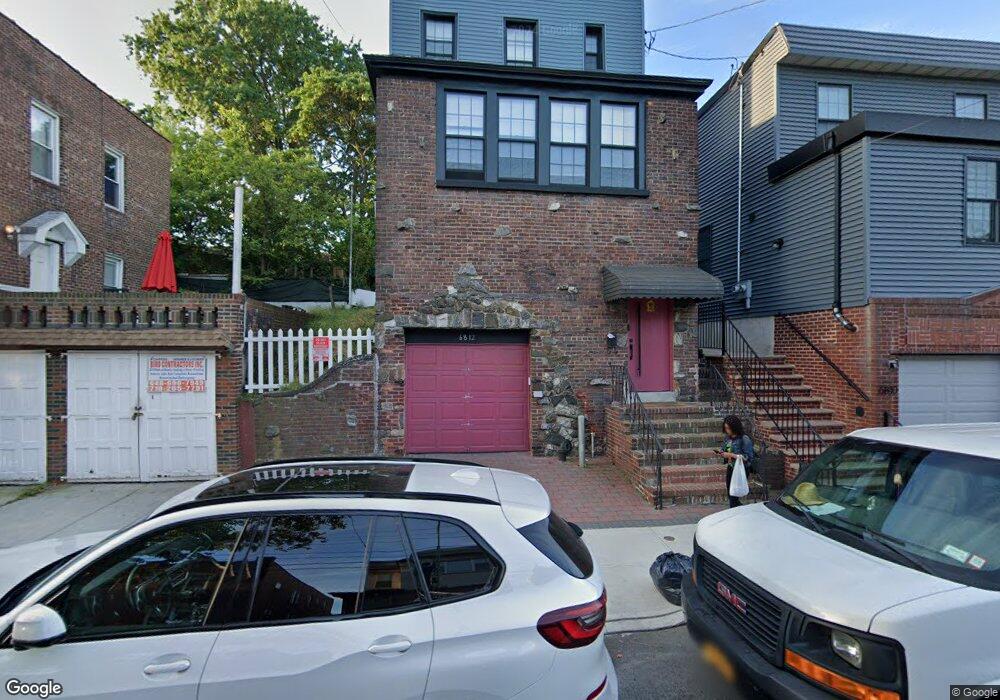
68-12 53rd Dr Flushing, NY 11378
Maspeth NeighborhoodEstimated Value: $931,000 - $1,145,000
4
Beds
2
Baths
1,516
Sq Ft
$668/Sq Ft
Est. Value
About This Home
This home is located at 68-12 53rd Dr, Flushing, NY 11378 and is currently estimated at $1,013,085, approximately $668 per square foot. 68-12 53rd Dr is a home located in Queens County with nearby schools including P.S. 229 Emanuel Kaplan, IS 73 - The Frank Sansivieri School, and Grover Cleveland High School.
Ownership History
Date
Name
Owned For
Owner Type
Purchase Details
Closed on
May 5, 2022
Sold by
Metro Realty Group Inc and Sb Fund Management Inc
Bought by
Loper Jamyang and Wangyal Thamden
Current Estimated Value
Home Financials for this Owner
Home Financials are based on the most recent Mortgage that was taken out on this home.
Original Mortgage
$824,000
Outstanding Balance
$778,659
Interest Rate
5%
Mortgage Type
Purchase Money Mortgage
Estimated Equity
$234,426
Purchase Details
Closed on
Apr 7, 2021
Sold by
Kaur Navpreet Gill As Executrix and Navpreet K. Gill As Executrix
Bought by
Metro Realty Group Inc and Sb Fund Management Inc
Home Financials for this Owner
Home Financials are based on the most recent Mortgage that was taken out on this home.
Original Mortgage
$460,000
Interest Rate
3.1%
Mortgage Type
Purchase Money Mortgage
Purchase Details
Closed on
Aug 30, 2017
Sold by
Hamby Deceased Veronica and Hamby Hamby
Bought by
Hamby Paul J
Create a Home Valuation Report for This Property
The Home Valuation Report is an in-depth analysis detailing your home's value as well as a comparison with similar homes in the area
Home Values in the Area
Average Home Value in this Area
Purchase History
| Date | Buyer | Sale Price | Title Company |
|---|---|---|---|
| Loper Jamyang | $1,030,000 | -- | |
| Loper Jamyang | $1,030,000 | -- | |
| Loper Jamyang | $1,030,000 | -- | |
| Metro Realty Group Inc | $575,000 | -- | |
| Metro Realty Group Inc | $575,000 | -- | |
| Metro Realty Group Inc | $575,000 | -- | |
| Hamby Paul J | -- | -- | |
| Hamby Paul J | -- | -- |
Source: Public Records
Mortgage History
| Date | Status | Borrower | Loan Amount |
|---|---|---|---|
| Open | Loper Jamyang | $824,000 | |
| Closed | Loper Jamyang | $824,000 | |
| Previous Owner | Metro Realty Group Inc | $460,000 |
Source: Public Records
Tax History
| Year | Tax Paid | Tax Assessment Tax Assessment Total Assessment is a certain percentage of the fair market value that is determined by local assessors to be the total taxable value of land and additions on the property. | Land | Improvement |
|---|---|---|---|---|
| 2025 | $5,958 | $30,954 | $6,267 | $24,687 |
| 2024 | $5,958 | $29,665 | $6,860 | $22,805 |
| 2023 | $5,699 | $28,373 | $5,607 | $22,766 |
| 2022 | $4,055 | $52,260 | $10,920 | $41,340 |
| 2021 | $5,429 | $55,920 | $10,920 | $45,000 |
| 2020 | $5,460 | $49,320 | $10,920 | $38,400 |
| 2019 | $5,171 | $47,160 | $10,920 | $36,240 |
| 2018 | $4,820 | $23,644 | $7,536 | $16,108 |
| 2017 | $4,601 | $22,572 | $6,637 | $15,935 |
| 2016 | $4,297 | $22,572 | $6,637 | $15,935 |
| 2015 | $2,568 | $21,496 | $6,420 | $15,076 |
| 2014 | $2,568 | $20,601 | $6,937 | $13,664 |
Source: Public Records
Map
Nearby Homes
Your Personal Tour Guide
Ask me questions while you tour the home.