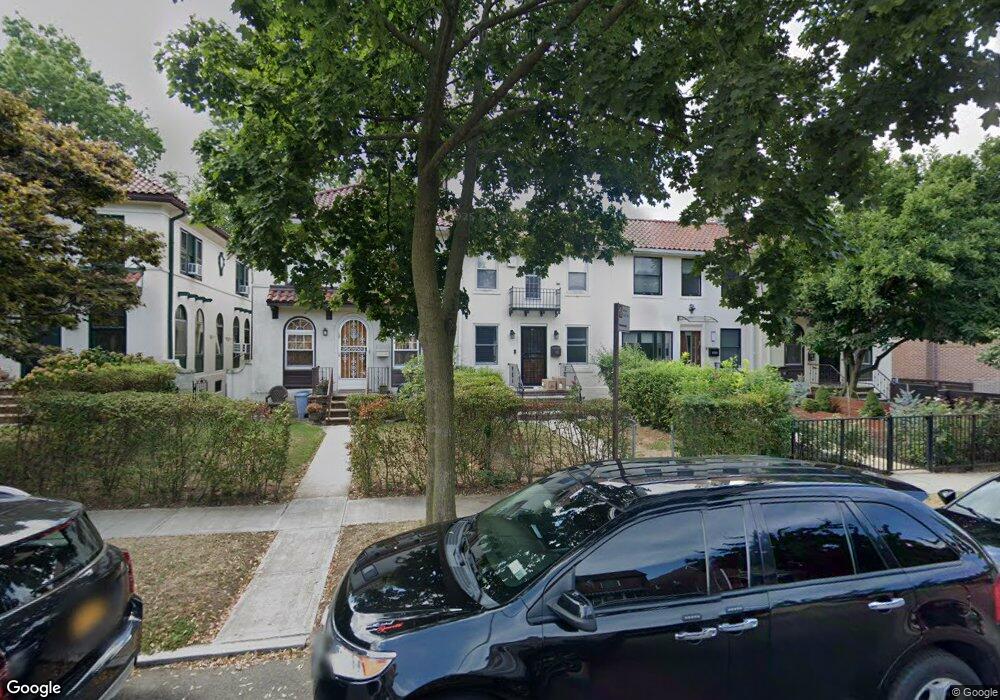
68-28 Fleet St Flushing, NY 11375
Forest Hills NeighborhoodEstimated Value: $1,137,832 - $1,367,000
3
Beds
3
Baths
1,440
Sq Ft
$883/Sq Ft
Est. Value
About This Home
This home is located at 68-28 Fleet St, Flushing, NY 11375 and is currently estimated at $1,271,208, approximately $882 per square foot. 68-28 Fleet St is a home located in Queens County with nearby schools including Ps 144 Col Jeromus Remsen, J.H.S. 190 Russell Sage, and Queens Metropolitan High School.
Ownership History
Date
Name
Owned For
Owner Type
Purchase Details
Closed on
Feb 12, 2024
Sold by
Dadi Haim and Dadi Katrenia
Bought by
Michael Dadi Trustee and The Dadi Family Trust Dated February 5
Current Estimated Value
Purchase Details
Closed on
Jun 14, 2019
Sold by
Atlantic Acquisitions Ny Llc
Bought by
Dadi Haim and Dadi Katrenia
Purchase Details
Closed on
May 30, 2019
Sold by
Vega As To Of Celina and Vega-Ciccone As To Cecila
Bought by
Atlantic Acquisitions Ny Llc
Purchase Details
Closed on
Feb 21, 2018
Sold by
Villegas Angelica
Bought by
Vega-Ciccone Cecilia and Villegas Angelica
Purchase Details
Closed on
Jun 11, 1999
Sold by
Villegas Angelica and Villegas John
Bought by
Villegas Angelica and Vega Celina
Purchase Details
Closed on
Jul 18, 1998
Sold by
Villegas Angelica and Villegas John
Bought by
Villegas Angelica and Vega Celina
Create a Home Valuation Report for This Property
The Home Valuation Report is an in-depth analysis detailing your home's value as well as a comparison with similar homes in the area
Home Values in the Area
Average Home Value in this Area
Purchase History
| Date | Buyer | Sale Price | Title Company |
|---|---|---|---|
| Michael Dadi Trustee | -- | -- | |
| Michael Dadi Trustee | -- | -- | |
| Dadi Haim | -- | -- | |
| Dadi Haim | -- | -- | |
| Atlantic Acquisitions Ny Llc | $830,000 | -- | |
| Atlantic Acquisitions Ny Llc | $830,000 | -- | |
| Vega-Ciccone Cecilia | -- | -- | |
| Vega-Ciccone Cecilia | -- | -- | |
| Villegas Angelica | -- | National Attorneys Title Ins | |
| Villegas Angelica | -- | National Attorneys Title Ins | |
| Villegas Angelica | -- | -- | |
| Villegas Angelica | -- | -- |
Source: Public Records
Tax History Compared to Growth
Tax History
| Year | Tax Paid | Tax Assessment Tax Assessment Total Assessment is a certain percentage of the fair market value that is determined by local assessors to be the total taxable value of land and additions on the property. | Land | Improvement |
|---|---|---|---|---|
| 2025 | $10,157 | $51,433 | $11,175 | $40,258 |
| 2024 | $10,157 | $50,572 | $12,605 | $37,967 |
| 2023 | $9,639 | $47,990 | $10,284 | $37,706 |
| 2022 | $8,600 | $73,260 | $14,940 | $58,320 |
| 2021 | $9,105 | $69,240 | $14,940 | $54,300 |
| 2020 | $748 | $67,080 | $14,940 | $52,140 |
| 2019 | $8,394 | $58,440 | $14,940 | $43,500 |
| 2018 | $7,742 | $37,977 | $10,566 | $27,411 |
| 2017 | $7,004 | $35,830 | $9,815 | $26,015 |
| 2016 | $6,495 | $35,830 | $9,815 | $26,015 |
| 2015 | $3,857 | $34,038 | $11,118 | $22,920 |
| 2014 | $3,857 | $33,440 | $11,998 | $21,442 |
Source: Public Records
Map
Nearby Homes
- 6836 Groton St
- 94-11 69th Ave Unit 102
- 94-11 69th Ave Unit 307
- 67-31 Ingram St
- 67-54 Groton St
- 68-37 Kessel St
- 67-49 Groton St
- 68-11 Dartmouth St
- 67-60 Exeter St
- 7267 Yellowstone Blvd
- 7285 Yellowstone Blvd
- 72-89 Yellowstone Blvd
- 6828 Kessel St
- 91-11 68th Ave
- 6851 Clyde St
- 6915 Loubet St
- 69-55 Kessel St
- 66-92 Selfridge St Unit 3J
- 66-92 Selfridge St Unit 1E
- 66-92 Selfridge St Unit 3E