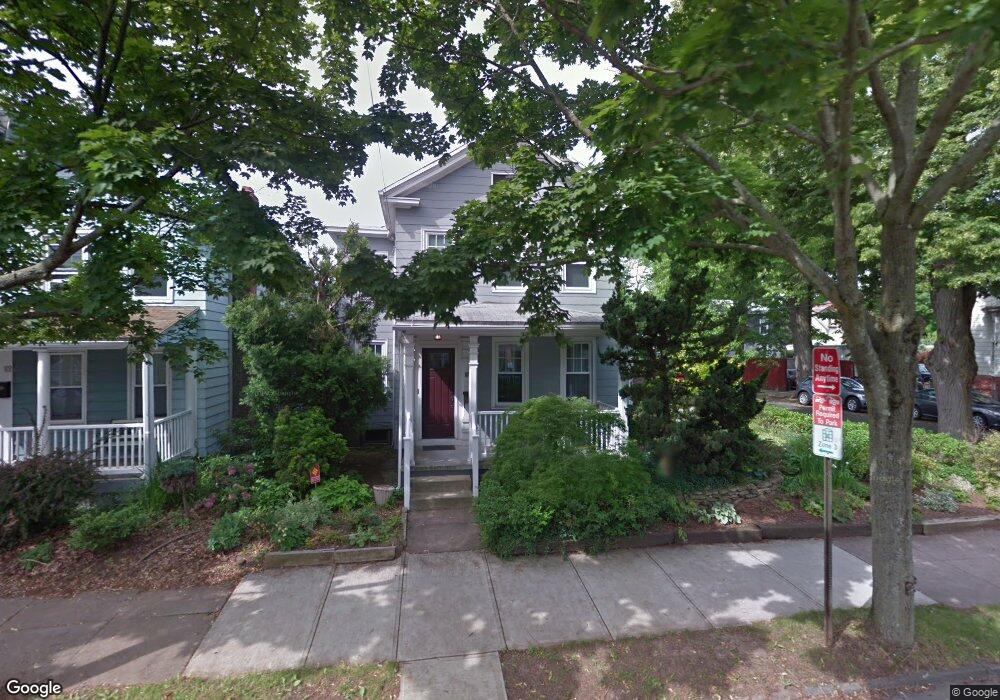
68 Clark St New Haven, CT 06511
East Rock NeighborhoodEstimated Value: $542,000 - $814,000
4
Beds
2
Baths
2,276
Sq Ft
$308/Sq Ft
Est. Value
About This Home
This home is located at 68 Clark St, New Haven, CT 06511 and is currently estimated at $699,901, approximately $307 per square foot. 68 Clark St is a home located in New Haven County with nearby schools including Booker T. Washington Academy and Elm City College Preparatory School.
Ownership History
Date
Name
Owned For
Owner Type
Purchase Details
Closed on
Sep 6, 2001
Sold by
Anisfeld Shim9on C and Anisfeld Sharon C
Bought by
Mcdermott Drew and Nugent Judith R
Current Estimated Value
Home Financials for this Owner
Home Financials are based on the most recent Mortgage that was taken out on this home.
Original Mortgage
$100,000
Outstanding Balance
$39,165
Interest Rate
7.05%
Estimated Equity
$660,736
Purchase Details
Closed on
Jul 23, 1998
Sold by
Pelli Rafael and Walbert Kate
Bought by
Anisfeld Shimon C and Anisfeld Sharon C
Home Financials for this Owner
Home Financials are based on the most recent Mortgage that was taken out on this home.
Original Mortgage
$148,500
Interest Rate
6.99%
Mortgage Type
Unknown
Purchase Details
Closed on
Jul 25, 1989
Sold by
Prince Edward M
Bought by
Pelli Rafael
Home Financials for this Owner
Home Financials are based on the most recent Mortgage that was taken out on this home.
Original Mortgage
$172,800
Interest Rate
10.07%
Create a Home Valuation Report for This Property
The Home Valuation Report is an in-depth analysis detailing your home's value as well as a comparison with similar homes in the area
Home Values in the Area
Average Home Value in this Area
Purchase History
| Date | Buyer | Sale Price | Title Company |
|---|---|---|---|
| Mcdermott Drew | $193,000 | -- | |
| Anisfeld Shimon C | $165,000 | -- | |
| Pelli Rafael | $216,000 | -- |
Source: Public Records
Mortgage History
| Date | Status | Borrower | Loan Amount |
|---|---|---|---|
| Open | Pelli Rafael | $100,000 | |
| Previous Owner | Pelli Rafael | $148,500 | |
| Previous Owner | Pelli Rafael | $172,800 |
Source: Public Records
Tax History Compared to Growth
Tax History
| Year | Tax Paid | Tax Assessment Tax Assessment Total Assessment is a certain percentage of the fair market value that is determined by local assessors to be the total taxable value of land and additions on the property. | Land | Improvement |
|---|---|---|---|---|
| 2025 | $13,991 | $355,110 | $219,730 | $135,380 |
| 2024 | $13,672 | $355,110 | $219,730 | $135,380 |
| 2023 | $13,210 | $355,110 | $219,730 | $135,380 |
| 2022 | $14,116 | $355,110 | $219,730 | $135,380 |
| 2021 | $11,976 | $272,930 | $168,840 | $104,090 |
| 2020 | $11,976 | $272,930 | $168,840 | $104,090 |
| 2019 | $11,731 | $272,930 | $168,840 | $104,090 |
| 2018 | $11,731 | $272,930 | $168,840 | $104,090 |
| 2017 | $10,985 | $283,990 | $168,840 | $115,150 |
| 2016 | $10,014 | $241,010 | $144,200 | $96,810 |
| 2015 | $10,014 | $241,010 | $144,200 | $96,810 |
| 2014 | $10,014 | $241,010 | $144,200 | $96,810 |
Source: Public Records
Map
Nearby Homes
- 44 Clark St
- 548 Orange St Unit 306
- 116 Bishop St
- 120 Bishop St
- 188 Bishop St
- 95 Audubon St Unit 222 aka 24
- 251 Lawrence St
- 257 Saint John St
- 335 Saint John St
- 106 Livingston St Unit A6
- 167 Willow St
- 299 Greene St Unit G-2
- 104 Haven St
- 73 Main St
- 67 Main St
- 29 Winchester Ave
- 39 Winchester Ave
- 244 James St
- 138 Mansfield St Unit 1
- 65 Anderson St
- 62 Clark St
- 13 Pleasant St Unit LL
- 13 Pleasant St Unit 1
- 13 Pleasant St Unit 3
- 13 Pleasant St Unit 3rd fl
- 13 Pleasant St Unit 1st fl
- 13 Pleasant St Unit 2nd fl
- 13 Pleasant St
- 60 Clark St
- 60 Clark St Unit 2
- 11 Pleasant St
- 56 Clark St
- 56 Clark St Unit 1
- 12 Pleasant St
- 69 Clark St Unit 2R
- 69 Clark St
- 69 Clark St Unit 1L
- 69 Clark St Unit Carriage House
- 69 Clark St Unit 2L
- 69 Clark St Unit 1R