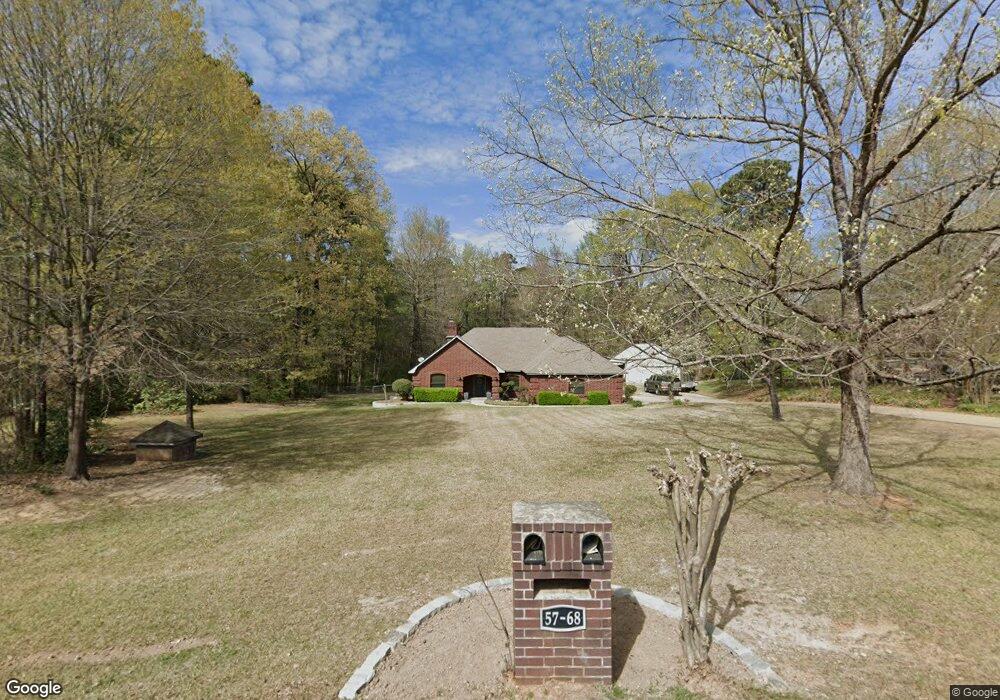
68 Dunham Dr Texarkana, TX 75503
Estimated Value: $269,597 - $304,000
--
Bed
--
Bath
2,029
Sq Ft
$145/Sq Ft
Est. Value
About This Home
This home is located at 68 Dunham Dr, Texarkana, TX 75503 and is currently estimated at $294,399, approximately $145 per square foot. 68 Dunham Dr is a home located in Bowie County with nearby schools including Margaret Fischer Davis Elementary School, Pleasant Grove Intermediate School, and Pleasant Grove Middle School.
Ownership History
Date
Name
Owned For
Owner Type
Purchase Details
Closed on
Apr 26, 2012
Sold by
Rumbo Paul Murray and Rumbo Mary Ann
Bought by
Good Carvel Wayne and Good Mary Dianne
Current Estimated Value
Home Financials for this Owner
Home Financials are based on the most recent Mortgage that was taken out on this home.
Original Mortgage
$180,310
Outstanding Balance
$124,307
Interest Rate
3.87%
Mortgage Type
FHA
Estimated Equity
$170,092
Purchase Details
Closed on
Sep 18, 2009
Sold by
Goodner Michael L and Goodner Robbie N
Bought by
Rumbo Paul Murray and Rumbo Mary Ann
Home Financials for this Owner
Home Financials are based on the most recent Mortgage that was taken out on this home.
Original Mortgage
$183,874
Interest Rate
5.36%
Mortgage Type
VA
Purchase Details
Closed on
Mar 6, 2008
Sold by
Duncan Bryan H and Duncan Connie C
Bought by
Goodner Michael L and Goodner Robbie N
Create a Home Valuation Report for This Property
The Home Valuation Report is an in-depth analysis detailing your home's value as well as a comparison with similar homes in the area
Home Values in the Area
Average Home Value in this Area
Purchase History
| Date | Buyer | Sale Price | Title Company |
|---|---|---|---|
| Good Carvel Wayne | -- | Stewart Title Of Texarkana | |
| Rumbo Paul Murray | -- | None Available | |
| Goodner Michael L | -- | None Available |
Source: Public Records
Mortgage History
| Date | Status | Borrower | Loan Amount |
|---|---|---|---|
| Open | Good Carvel Wayne | $180,310 | |
| Previous Owner | Rumbo Paul Murray | $183,874 |
Source: Public Records
Tax History Compared to Growth
Tax History
| Year | Tax Paid | Tax Assessment Tax Assessment Total Assessment is a certain percentage of the fair market value that is determined by local assessors to be the total taxable value of land and additions on the property. | Land | Improvement |
|---|---|---|---|---|
| 2025 | $3,866 | $238,540 | $20,603 | $217,937 |
| 2024 | $3,866 | $236,003 | $20,603 | $215,400 |
| 2023 | $3,739 | $224,584 | $20,603 | $203,981 |
| 2022 | $3,719 | $198,383 | $20,603 | $177,780 |
| 2021 | $3,292 | $165,174 | $16,632 | $148,542 |
| 2020 | $3,183 | $158,554 | $16,632 | $141,922 |
| 2019 | $3,161 | $152,259 | $16,632 | $135,627 |
| 2018 | $3,066 | $149,040 | $16,632 | $132,408 |
| 2017 | $3,013 | $146,639 | $16,632 | $130,007 |
| 2016 | $3,013 | $146,639 | $16,632 | $130,007 |
| 2015 | $3,021 | $148,634 | $16,632 | $132,002 |
| 2014 | $3,021 | $143,935 | $16,632 | $127,303 |
Source: Public Records
Map
Nearby Homes
- 37 Leggett Dr
- 33 Leggett Dr
- 170 Bighorn
- 181 Bighorn
- 160 Bighorn
- 150 Bighorn
- 100 Yellowstone
- 6826 Maple View Ln
- 300 Yellowstone
- 6917 Woodmere Ct
- 350 Blackhills
- 6814 Maple View Ln
- Lot 2 Blk 2 Cooper Lane Est III
- TBD Lionel Ave
- 6703 Richmond Rd
- 142 Easy St
- 6106 Sagebrush Ave
- 6408 Prestige Ln
- 8414 Mandarin Cove
- 5703 Sleepy Hollow Ave