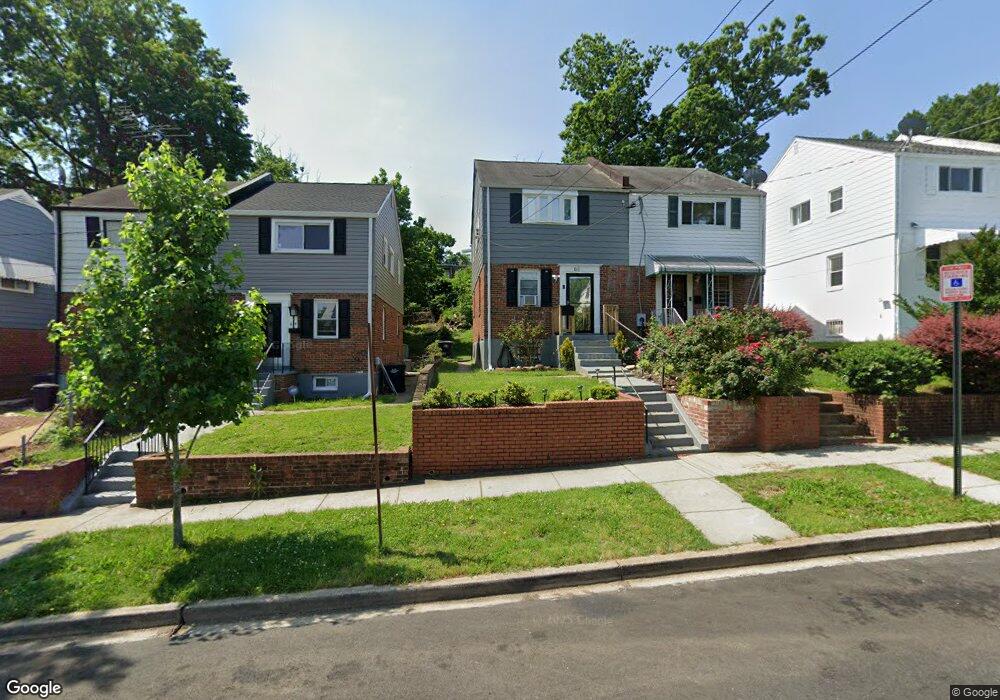
68 Elmira St SW Washington, DC 20032
Bellevue NeighborhoodEstimated Value: $289,537 - $333,000
3
Beds
2
Baths
1,024
Sq Ft
$301/Sq Ft
Est. Value
About This Home
This home is located at 68 Elmira St SW, Washington, DC 20032 and is currently estimated at $308,134, approximately $300 per square foot. 68 Elmira St SW is a home located in District of Columbia with nearby schools including W.B. Patterson Elementary School, Hart Middle School, and Ballou High School.
Ownership History
Date
Name
Owned For
Owner Type
Purchase Details
Closed on
Apr 30, 2010
Sold by
Swan Properties Inc
Bought by
Jackson Marcus S
Current Estimated Value
Home Financials for this Owner
Home Financials are based on the most recent Mortgage that was taken out on this home.
Original Mortgage
$176,027
Outstanding Balance
$120,553
Interest Rate
5.5%
Mortgage Type
FHA
Estimated Equity
$187,581
Purchase Details
Closed on
Dec 28, 2009
Sold by
Deutsche Bank Natl Trust Co Tr
Bought by
Swan Properties Inc
Home Financials for this Owner
Home Financials are based on the most recent Mortgage that was taken out on this home.
Original Mortgage
$102,631
Interest Rate
4.78%
Mortgage Type
New Conventional
Purchase Details
Closed on
Jan 6, 2009
Sold by
Claiborne Augustine
Bought by
Bankers Trust Co and Deutsche Bank Tr Co,
Create a Home Valuation Report for This Property
The Home Valuation Report is an in-depth analysis detailing your home's value as well as a comparison with similar homes in the area
Home Values in the Area
Average Home Value in this Area
Purchase History
| Date | Buyer | Sale Price | Title Company |
|---|---|---|---|
| Jackson Marcus S | $185,000 | -- | |
| Swan Properties Inc | $67,631 | -- | |
| Bankers Trust Co | $191,250 | -- |
Source: Public Records
Mortgage History
| Date | Status | Borrower | Loan Amount |
|---|---|---|---|
| Open | Jackson Marcus S | $176,027 | |
| Previous Owner | Swan Properties Inc | $102,631 |
Source: Public Records
Tax History Compared to Growth
Tax History
| Year | Tax Paid | Tax Assessment Tax Assessment Total Assessment is a certain percentage of the fair market value that is determined by local assessors to be the total taxable value of land and additions on the property. | Land | Improvement |
|---|---|---|---|---|
| 2025 | $2,396 | $281,900 | $139,860 | $142,040 |
| 2024 | $2,291 | $269,490 | $135,470 | $134,020 |
| 2023 | $2,197 | $258,490 | $130,380 | $128,110 |
| 2022 | $1,981 | $233,110 | $125,600 | $107,510 |
| 2021 | $1,902 | $223,730 | $123,740 | $99,990 |
| 2020 | $1,834 | $215,720 | $120,330 | $95,390 |
| 2019 | $1,728 | $203,320 | $118,830 | $84,490 |
| 2018 | $1,638 | $192,730 | $0 | $0 |
| 2017 | $1,590 | $187,050 | $0 | $0 |
| 2016 | $1,430 | $168,220 | $0 | $0 |
| 2015 | -- | $140,580 | $0 | $0 |
| 2014 | -- | $137,370 | $0 | $0 |
Source: Public Records
Map
Nearby Homes
- 65 Forrester St SW
- 136 Darrington St SW
- 76 Galveston Place SW Unit E
- 161 Elmira St SW
- 151 Darrington St SW
- 150 Chesapeake St SW
- 6 Galveston St SW Unit 103
- 4715 1st St SW Unit 203
- 4715 1st St SW Unit 302
- 125 Chesapeake St SW
- 4717 1st St SW Unit 302
- 4717 1st St SW Unit 303
- 4717 1st St SW Unit 203
- 4250 Martin Luther King jr Ave SW
- 4725 1st St SW Unit 303
- 20 Chesapeake St SE Unit 41
- 4104 Martin Luther King jr Ave SW
- 4733 1st St SW Unit 102
- 107 Joliet St SW
- 6 Brandywine St SE
- 70 Elmira St SW
- 74 Elmira St SW
- 64 Elmira St SW
- 76 Elmira St SW
- 62 Elmira St SW
- 80 Elmira St SW
- 82 Elmira St SW
- 58 Elmira St SW
- 56 Elmira St SW
- 86 Elmira St SW
- 52 Elmira St SW
- 88 Elmira St SW
- 71 Forrester St SW
- 73 Forrester St SW
- 67 Forrester St SW
- 92 Elmira St SW
- 50 Elmira St SW
- 77 Forrester St SW
- 46 Elmira St SW
- 94 Elmira St SW