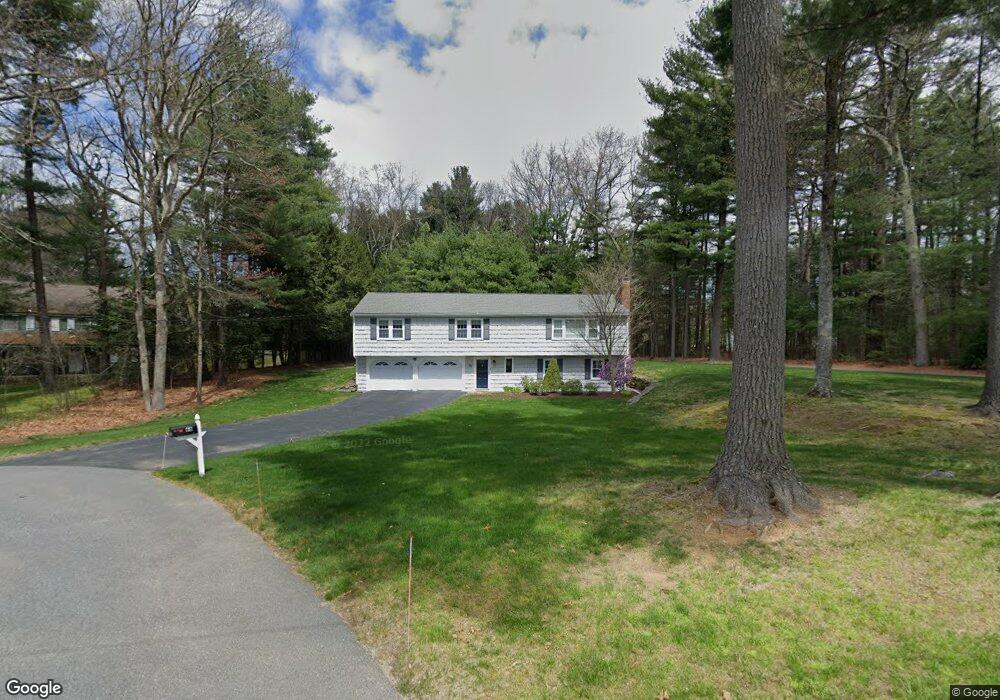
68 Wagonwheel Rd Sudbury, MA 01776
Estimated Value: $826,000 - $1,277,000
4
Beds
3
Baths
1,568
Sq Ft
$616/Sq Ft
Est. Value
About This Home
This home is located at 68 Wagonwheel Rd, Sudbury, MA 01776 and is currently estimated at $966,596, approximately $616 per square foot. 68 Wagonwheel Rd is a home located in Middlesex County with nearby schools including Israel Loring Elementary School, Ephraim Curtis Middle School, and Lincoln-Sudbury Regional High School.
Ownership History
Date
Name
Owned For
Owner Type
Purchase Details
Closed on
Jul 18, 2022
Sold by
Zarrilli Gerard V
Bought by
Zarrilli Gerard V and Northrup Wendy
Current Estimated Value
Purchase Details
Closed on
Jan 14, 2022
Sold by
Feinberg Mark A and Feinberg Audrey L
Bought by
Audrey L Feinberg Lt
Purchase Details
Closed on
May 25, 2000
Sold by
Wickersham Mark W and Wickersham Kristen P
Bought by
Feinberg Mark A and Feinberg Audrey L
Home Financials for this Owner
Home Financials are based on the most recent Mortgage that was taken out on this home.
Original Mortgage
$300,000
Interest Rate
8.1%
Mortgage Type
Purchase Money Mortgage
Purchase Details
Closed on
Mar 12, 1999
Sold by
Zarrilli Mary E
Bought by
Zarrilli Gerard V and Wickersham Kristin P
Purchase Details
Closed on
Sep 3, 1992
Sold by
Rt Simeone
Bought by
Feinberg Mark A and Getman Audrey L
Create a Home Valuation Report for This Property
The Home Valuation Report is an in-depth analysis detailing your home's value as well as a comparison with similar homes in the area
Home Values in the Area
Average Home Value in this Area
Purchase History
| Date | Buyer | Sale Price | Title Company |
|---|---|---|---|
| Zarrilli Gerard V | -- | None Available | |
| Zarrilli Gerard V | -- | None Available | |
| Audrey L Feinberg Lt | -- | None Available | |
| Audrey L Feinberg Lt | -- | None Available | |
| Feinberg Mark A | $432,000 | -- | |
| Zarrilli Gerard V | $7,500 | -- | |
| Feinberg Mark A | $255,000 | -- | |
| Feinberg Mark A | $255,000 | -- |
Source: Public Records
Mortgage History
| Date | Status | Borrower | Loan Amount |
|---|---|---|---|
| Previous Owner | Feinberg Mark A | $247,000 | |
| Previous Owner | Feinberg Mark A | $296,000 | |
| Previous Owner | Feinberg Mark A | $300,000 |
Source: Public Records
Tax History
| Year | Tax Paid | Tax Assessment Tax Assessment Total Assessment is a certain percentage of the fair market value that is determined by local assessors to be the total taxable value of land and additions on the property. | Land | Improvement |
|---|---|---|---|---|
| 2025 | $11,355 | $775,600 | $440,400 | $335,200 |
| 2024 | $10,981 | $751,600 | $427,600 | $324,000 |
| 2023 | $10,870 | $689,300 | $396,000 | $293,300 |
| 2022 | $10,265 | $568,700 | $363,600 | $205,100 |
| 2021 | $10,151 | $539,100 | $363,600 | $175,500 |
| 2020 | $9,946 | $539,100 | $363,600 | $175,500 |
| 2019 | $9,655 | $539,100 | $363,600 | $175,500 |
| 2018 | $9,537 | $531,900 | $387,600 | $144,300 |
| 2017 | $8,936 | $503,700 | $368,800 | $134,900 |
| 2016 | $8,606 | $483,500 | $354,800 | $128,700 |
| 2015 | $7,976 | $453,200 | $324,200 | $129,000 |
| 2014 | $7,966 | $441,800 | $314,700 | $127,100 |
Source: Public Records
Map
Nearby Homes
- 0 Wagonwheel Rd
- 87 Landham Rd
- 63 Landham Rd
- 10 Brookside Farm Ln
- 9 Lands End Ln
- 216 Landham Rd
- 21 Potter Rd
- 38 Bradford Rd
- 472 Potter Rd
- 34 Christopher Ln
- 226 Stonebridge Rd
- 10 Rolling Ln
- 4 Tartufi Cir
- 192 Boston Post Rd Unit 8
- 33 Oak Hill Rd
- 11 Edith Rd
- 19 Nob Hill Dr
- 1011 Boston Post Rd
- 32 Eaton Rd W
- 58 Massasoit Ave
- 58 Wagonwheel Rd
- 72 Wagonwheel Rd
- 69 Wagonwheel Rd
- 65 Wagonwheel Rd
- 33 Lettery Cir
- 83 Woodside Rd
- 37 Lettery Cir
- 54 Wagonwheel Rd
- 57 Wagonwheel Rd
- 51 Wagonwheel Rd
- 73 Woodside Rd
- 29 Lettery Cir
- 51 Dawson Dr
- 38 Lettery Cir
- 79 Woodside Rd
- 46 Wagonwheel Rd
- 87 Woodside Rd
- 60 Patricia Rd
- 47 Wagonwheel Rd
- 25 Lettery Cir
Your Personal Tour Guide
Ask me questions while you tour the home.