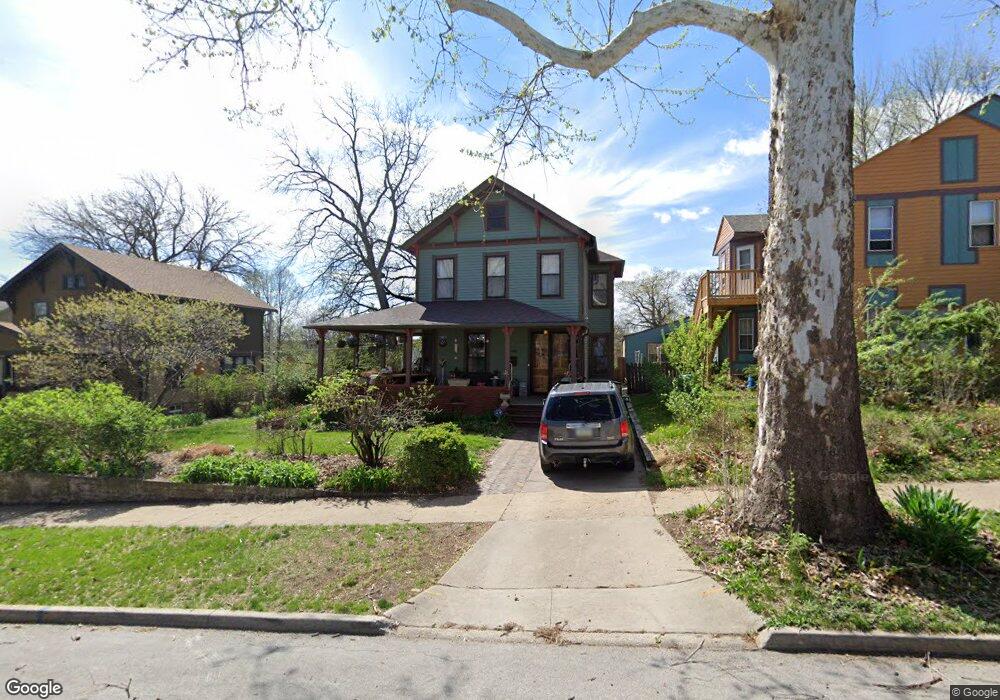
680 18th St Des Moines, IA 50314
Sherman Hill NeighborhoodEstimated Value: $407,000 - $495,000
4
Beds
3
Baths
2,428
Sq Ft
$184/Sq Ft
Est. Value
About This Home
This home is located at 680 18th St, Des Moines, IA 50314 and is currently estimated at $447,901, approximately $184 per square foot. 680 18th St is a home located in Polk County with nearby schools including Callanan Middle School and Roosevelt High School.
Ownership History
Date
Name
Owned For
Owner Type
Purchase Details
Closed on
Feb 24, 2011
Sold by
National Residential Nominee Services In
Bought by
Mcmahon Stephen L and Roberts Julie M
Current Estimated Value
Home Financials for this Owner
Home Financials are based on the most recent Mortgage that was taken out on this home.
Original Mortgage
$213,085
Outstanding Balance
$145,671
Interest Rate
4.76%
Mortgage Type
New Conventional
Estimated Equity
$302,230
Purchase Details
Closed on
Feb 27, 2008
Sold by
Clancy Michael D
Bought by
Clancy Michael D and Clancy Nora I
Purchase Details
Closed on
Oct 21, 2007
Sold by
Bruner Jeffrey G and Bruner Stephanie M
Bought by
Clancy Michael D
Home Financials for this Owner
Home Financials are based on the most recent Mortgage that was taken out on this home.
Original Mortgage
$268,000
Interest Rate
6.33%
Mortgage Type
Purchase Money Mortgage
Purchase Details
Closed on
Oct 28, 2000
Sold by
Taenzer York A
Bought by
Bruner Jeffrey G and Bruner Stephanie M
Home Financials for this Owner
Home Financials are based on the most recent Mortgage that was taken out on this home.
Original Mortgage
$154,900
Interest Rate
7.9%
Create a Home Valuation Report for This Property
The Home Valuation Report is an in-depth analysis detailing your home's value as well as a comparison with similar homes in the area
Home Values in the Area
Average Home Value in this Area
Purchase History
| Date | Buyer | Sale Price | Title Company |
|---|---|---|---|
| Mcmahon Stephen L | $224,000 | None Available | |
| Clancy Michael D | -- | None Available | |
| Clancy Michael D | $267,500 | None Available | |
| Bruner Jeffrey G | $151,500 | -- |
Source: Public Records
Mortgage History
| Date | Status | Borrower | Loan Amount |
|---|---|---|---|
| Open | Mcmahon Stephen L | $213,085 | |
| Previous Owner | Clancy Michael D | $268,000 | |
| Previous Owner | Bruner Jeffrey G | $154,900 | |
| Closed | Bruner Jeffrey G | $17,345 |
Source: Public Records
Tax History Compared to Growth
Tax History
| Year | Tax Paid | Tax Assessment Tax Assessment Total Assessment is a certain percentage of the fair market value that is determined by local assessors to be the total taxable value of land and additions on the property. | Land | Improvement |
|---|---|---|---|---|
| 2025 | $7,854 | $445,400 | $61,600 | $383,800 |
| 2024 | $7,854 | $396,100 | $54,700 | $341,400 |
| 2023 | $7,364 | $396,100 | $54,700 | $341,400 |
| 2022 | $7,304 | $310,800 | $44,300 | $266,500 |
| 2021 | $6,986 | $310,800 | $44,300 | $266,500 |
| 2020 | $7,238 | $279,400 | $40,200 | $239,200 |
| 2019 | $6,806 | $279,400 | $40,200 | $239,200 |
| 2018 | $6,730 | $254,000 | $36,200 | $217,800 |
| 2017 | $6,280 | $254,000 | $36,200 | $217,800 |
| 2016 | $6,114 | $233,600 | $33,300 | $200,300 |
| 2015 | $6,114 | $233,600 | $33,300 | $200,300 |
| 2014 | $6,076 | $230,400 | $32,600 | $197,800 |
Source: Public Records
Map
Nearby Homes
- 686 18th St
- 686 18th St Unit 1-5
- 672 18th St
- 670 18th St
- 681 19th St
- 673 19th St
- 685 19th St
- 696 18th St
- 664 18th St
- 1808 Pleasant St Unit 6
- 1808 Pleasant St Unit 5
- 1808 Pleasant St Unit 4
- 1808 Pleasant St Unit 3
- 1808 Pleasant St Unit 2
- 1808 Pleasant St Unit 1
- 1808 Pleasant St
- 693 19th St
- 679 18th St
- 681 18th St
- 675 18th St