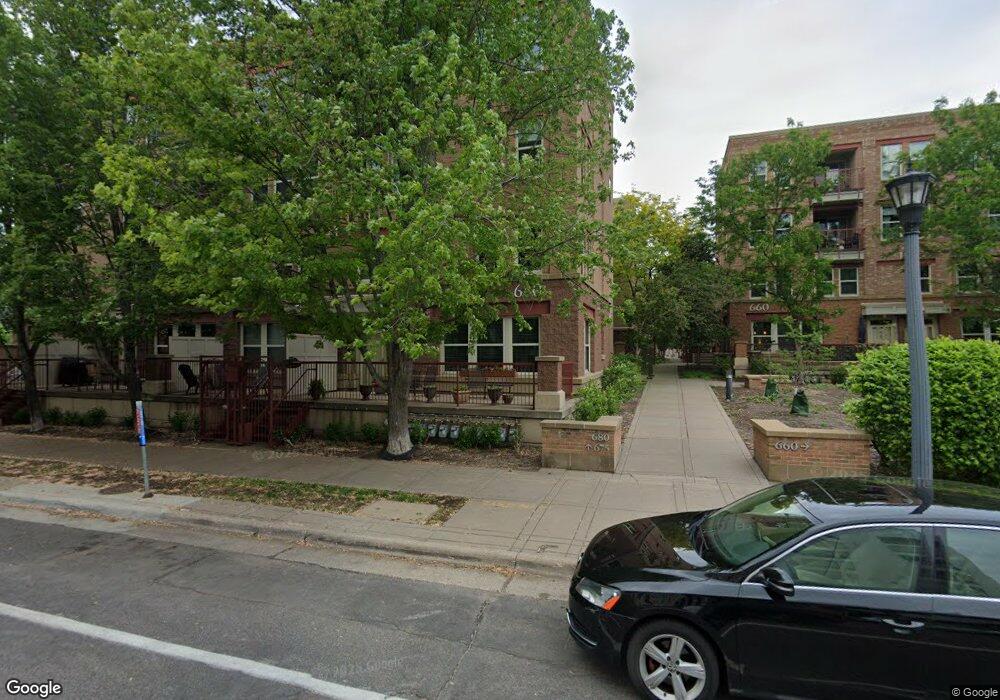
680 N 2nd St Unit 400 Minneapolis, MN 55401
North Loop NeighborhoodEstimated Value: $387,000 - $413,000
2
Beds
3
Baths
1,258
Sq Ft
$319/Sq Ft
Est. Value
About This Home
This home is located at 680 N 2nd St Unit 400, Minneapolis, MN 55401 and is currently estimated at $400,748, approximately $318 per square foot. 680 N 2nd St Unit 400 is a home located in Hennepin County with nearby schools including Webster Elementary, Northeast Middle School, and Thomas Edison High School.
Ownership History
Date
Name
Owned For
Owner Type
Purchase Details
Closed on
Sep 18, 2017
Sold by
Ries Edith Darling and Ries Kevin M
Bought by
Wong Kevin and Nagib Hana
Current Estimated Value
Home Financials for this Owner
Home Financials are based on the most recent Mortgage that was taken out on this home.
Original Mortgage
$279,000
Outstanding Balance
$232,985
Interest Rate
3.9%
Mortgage Type
New Conventional
Estimated Equity
$167,763
Purchase Details
Closed on
Mar 8, 2013
Sold by
Ries Jennifer J
Bought by
Ries Edith Darling and Ires Kevin M
Purchase Details
Closed on
Jun 28, 2012
Sold by
Jennifer J Ries
Bought by
River Station Condominium Owners' Associ
Purchase Details
Closed on
May 13, 2005
Sold by
Majkrzak Ryan D
Bought by
Ries Jennifer J
Purchase Details
Closed on
Mar 28, 2003
Sold by
Downing Kristine K
Bought by
Majkrzak Ryan D
Purchase Details
Closed on
Jul 28, 1998
Sold by
Heritage Renovation Llc
Bought by
Downing Kristine K
Create a Home Valuation Report for This Property
The Home Valuation Report is an in-depth analysis detailing your home's value as well as a comparison with similar homes in the area
Home Values in the Area
Average Home Value in this Area
Purchase History
| Date | Buyer | Sale Price | Title Company |
|---|---|---|---|
| Wong Kevin | $372,000 | Edina Realty Title Inc | |
| Ries Edith Darling | -- | None Available | |
| River Station Condominium Owners' Associ | $23,269 | -- | |
| River Station Condominium Owners Associa | $23,268 | None Available | |
| Ries Jennifer J | $277,940 | -- | |
| Majkrzak Ryan D | $254,000 | -- | |
| Downing Kristine K | $154,731 | -- |
Source: Public Records
Mortgage History
| Date | Status | Borrower | Loan Amount |
|---|---|---|---|
| Open | Wong Kevin | $279,000 |
Source: Public Records
Tax History Compared to Growth
Tax History
| Year | Tax Paid | Tax Assessment Tax Assessment Total Assessment is a certain percentage of the fair market value that is determined by local assessors to be the total taxable value of land and additions on the property. | Land | Improvement |
|---|---|---|---|---|
| 2024 | $5,710 | $394,000 | $114,000 | $280,000 |
| 2023 | $4,896 | $378,000 | $114,000 | $264,000 |
| 2022 | $5,034 | $367,000 | $103,000 | $264,000 |
| 2021 | $4,751 | $367,000 | $93,000 | $274,000 |
| 2020 | $5,148 | $359,500 | $55,800 | $303,700 |
| 2019 | $4,926 | $359,500 | $27,900 | $331,600 |
| 2018 | $4,598 | $336,000 | $27,900 | $308,100 |
| 2017 | $4,635 | $301,000 | $27,900 | $273,100 |
| 2016 | $4,445 | $279,500 | $27,900 | $251,600 |
| 2015 | $4,158 | $249,000 | $27,900 | $221,100 |
| 2014 | -- | $214,500 | $27,900 | $186,600 |
Source: Public Records
Map
Nearby Homes
- 680 N 2nd St Unit 403
- 660 N 2nd St Unit 303
- 645 N 1st St Unit 305
- 645 N 1st St Unit 125
- 618 Washington Ave N Unit 304
- 718 Washington Ave N Unit 612
- 718 Washington Ave N Unit 602
- 580 N 2nd St Unit 300
- 716 N 1st St Unit 536
- 700 Washington Ave N Unit 523
- 700 Washington Ave N Unit 627
- 700 Washington Ave N Unit 507
- 700 Washington Ave N Unit 207
- 700 Washington Ave N Unit 615
- 560 N 2nd St Unit 410
- 560 N 2nd St Unit 114
- 545 N 1st St Unit 125
- 545 N 1st St Unit 123
- 728 3rd St N Unit 501
- 728 3rd St N Unit 705
- 680 N 2nd St Unit 407
- 680 N 2nd St Unit 406
- 680 N 2nd St Unit 405
- 680 N 2nd St Unit 404
- 680 N 2nd St Unit 402
- 680 N 2nd St Unit 401
- 680 N 2nd St Unit 304
- 680 N 2nd St Unit 303
- 680 N 2nd St Unit 302
- 680 N 2nd St Unit 301
- 680 N 2nd St Unit 120
- 680 N 2nd St Unit 118
- 680 N 2nd St Unit 116
- 680 N 2nd St Unit 114
- 680 N 2nd St Unit 112
- 680 N 2nd St Unit 110
- 680 N 2nd St Unit 108
- 680 N 2nd St Unit 106
- 680 N 2nd St Unit 104
- 680 N 2nd St Unit 102