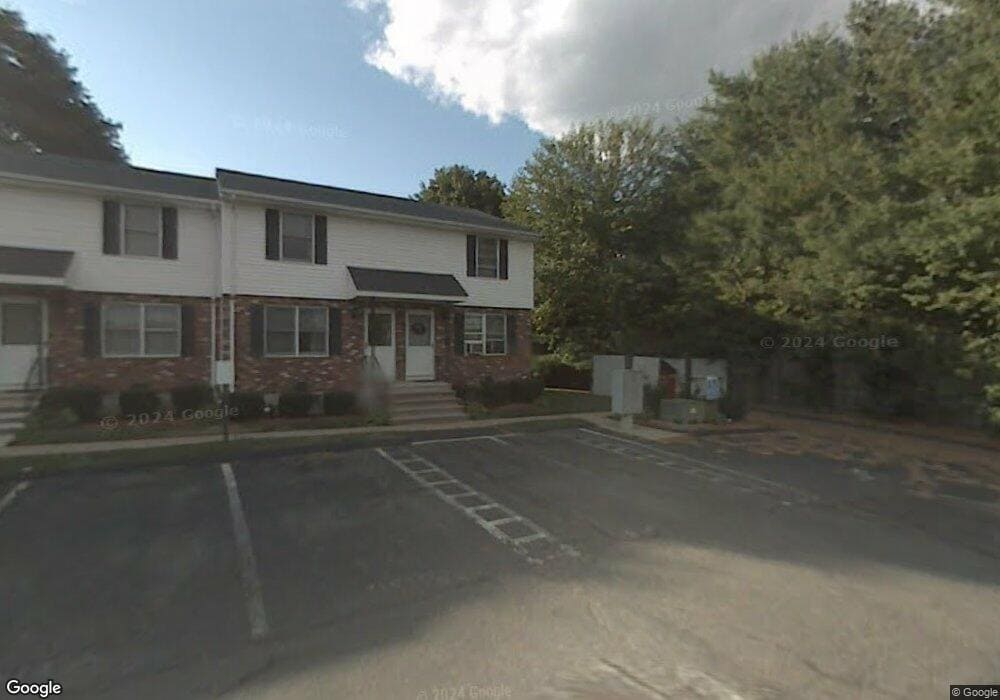
680 N Colony Rd Unit 5 Meriden, CT 06450
Estimated Value: $215,013 - $245,000
2
Beds
2
Baths
1,040
Sq Ft
$216/Sq Ft
Est. Value
About This Home
This home is located at 680 N Colony Rd Unit 5, Meriden, CT 06450 and is currently estimated at $224,753, approximately $216 per square foot. 680 N Colony Rd Unit 5 is a home located in New Haven County with nearby schools including John Barry School, Washington Middle School, and Francis T. Maloney High School.
Ownership History
Date
Name
Owned For
Owner Type
Purchase Details
Closed on
May 2, 2019
Sold by
Osunde Uly
Bought by
Dogwood Estates Holdings
Current Estimated Value
Purchase Details
Closed on
Nov 27, 2012
Sold by
Department Of Housing & Urban Dev
Bought by
Saia Antonio
Purchase Details
Closed on
May 4, 2012
Sold by
Chfa
Bought by
Department Of Housing & Urban Dev
Purchase Details
Closed on
Jan 18, 2005
Sold by
Dennehey Edward F and Dennehey Pamela H
Bought by
Briggs Michael R and Briggs Daphne M
Home Financials for this Owner
Home Financials are based on the most recent Mortgage that was taken out on this home.
Original Mortgage
$116,400
Interest Rate
5.81%
Purchase Details
Closed on
Feb 26, 1988
Sold by
W H Meyers & Sons
Bought by
Dennehey Edward F
Home Financials for this Owner
Home Financials are based on the most recent Mortgage that was taken out on this home.
Original Mortgage
$101,600
Interest Rate
10.49%
Create a Home Valuation Report for This Property
The Home Valuation Report is an in-depth analysis detailing your home's value as well as a comparison with similar homes in the area
Home Values in the Area
Average Home Value in this Area
Purchase History
| Date | Buyer | Sale Price | Title Company |
|---|---|---|---|
| Dogwood Estates Holdings | -- | -- | |
| Saia Antonio | $46,000 | -- | |
| Department Of Housing & Urban Dev | -- | -- | |
| Briggs Michael R | $120,000 | -- | |
| Dennehey Edward F | $112,900 | -- |
Source: Public Records
Mortgage History
| Date | Status | Borrower | Loan Amount |
|---|---|---|---|
| Previous Owner | Dennehey Edward F | $15,789 | |
| Previous Owner | Dennehey Edward F | $116,400 | |
| Previous Owner | Dennehey Edward F | $101,600 |
Source: Public Records
Tax History Compared to Growth
Tax History
| Year | Tax Paid | Tax Assessment Tax Assessment Total Assessment is a certain percentage of the fair market value that is determined by local assessors to be the total taxable value of land and additions on the property. | Land | Improvement |
|---|---|---|---|---|
| 2025 | $2,694 | $71,050 | $0 | $71,050 |
| 2024 | $2,736 | $71,050 | $0 | $71,050 |
| 2023 | $2,637 | $71,050 | $0 | $71,050 |
| 2022 | $2,488 | $71,050 | $0 | $71,050 |
| 2021 | $2,959 | $67,970 | $0 | $67,970 |
| 2020 | $2,951 | $67,970 | $0 | $67,970 |
| 2019 | $2,925 | $67,970 | $0 | $67,970 |
| 2018 | $2,937 | $67,970 | $0 | $67,970 |
| 2017 | $2,859 | $67,970 | $0 | $67,970 |
| 2016 | $2,977 | $76,790 | $0 | $76,790 |
| 2015 | $2,977 | $76,790 | $0 | $76,790 |
| 2014 | $2,905 | $76,790 | $0 | $76,790 |
Source: Public Records
Map
Nearby Homes
- 181 Hicks St Unit 2C
- 51 Griswold St
- 30 Tremont St
- 396 Gracey Ave
- 149 Woodland St
- 35 Morse St
- 334 Gracey Ave
- 618 Blackstone Village
- 53 Woodland St
- 52 Webster St
- 19 Blackstone St
- 33 Prescott St
- 23 Howe St
- 929 N Colony Rd Unit 6
- 419 Gracey Ave
- 22 Webster St
- 387 Colony St
- 64 Fair St
- 497 Gracey Ave
- 9 Milton Dr
- 680 N Colony Rd Unit 43
- 680 N Colony Rd Unit 14
- 680 N Colony Rd Unit 27
- 680 N Colony Rd Unit 22
- 680 N Colony Rd Unit 20
- 680 N Colony Rd Unit 28
- 680 N Colony St Unit 9
- 680 N Colony St Unit 8
- 680 N Colony St Unit 7
- 680 N Colony St Unit 6
- 680 N Colony St Unit 5
- 680 N Colony St Unit 44
- 680 N Colony St Unit 43
- 680 N Colony St Unit 42
- 680 N Colony St Unit 41
- 680 N Colony St Unit 40
- 680 N Colony St Unit 4
- 680 N Colony St Unit 39
- 680 N Colony St Unit 38
- 680 N Colony St Unit 37