Estimated Value: $528,000 - $578,000
4
Beds
4
Baths
3,480
Sq Ft
$160/Sq Ft
Est. Value
About This Home
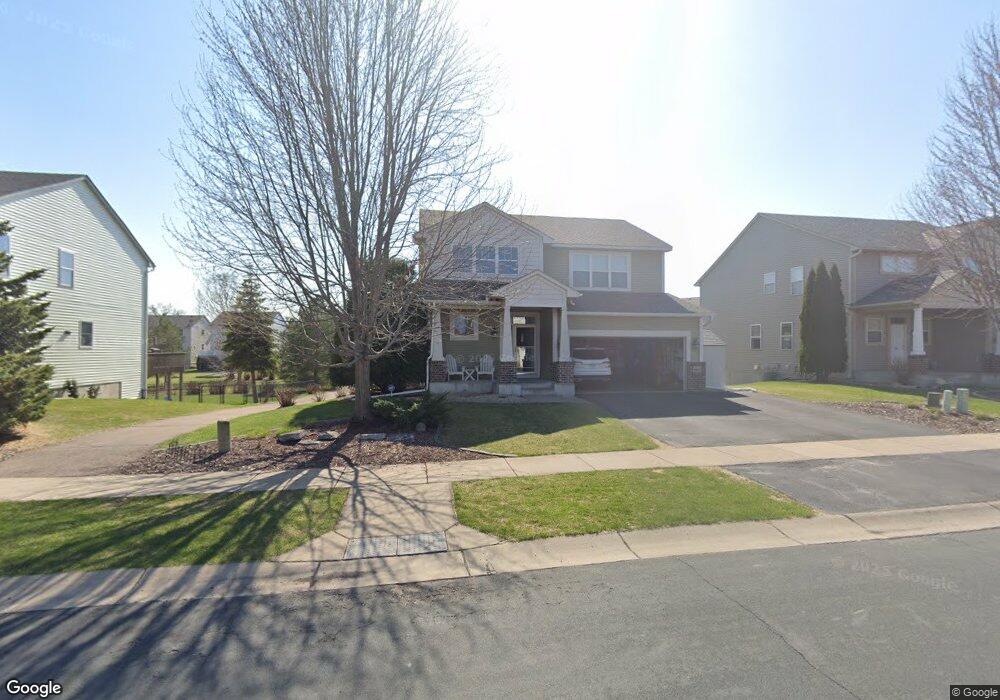
This home is located at 6801 Troy Ln N, Osseo, MN 55311 and is currently estimated at $555,628, approximately $159 per square foot. 6801 Troy Ln N is a home located in Hennepin County with nearby schools including Basswood Elementary School, Maple Grove Middle School, and Maple Grove Senior High School.
Ownership History
Date
Name
Owned For
Owner Type
Purchase Details
Closed on
Jun 28, 2019
Sold by
Louden Sarah
Bought by
Mast Andrew
Current Estimated Value
Home Financials for this Owner
Home Financials are based on the most recent Mortgage that was taken out on this home.
Original Mortgage
$387,000
Outstanding Balance
$339,047
Interest Rate
3.82%
Mortgage Type
New Conventional
Estimated Equity
$216,581
Purchase Details
Closed on
Jun 5, 2015
Sold by
Buchholtz Christopher Michael and Buchholtz Angie
Bought by
Louden Sarah
Home Financials for this Owner
Home Financials are based on the most recent Mortgage that was taken out on this home.
Original Mortgage
$327,635
Interest Rate
3.5%
Mortgage Type
FHA
Purchase Details
Closed on
Mar 3, 2005
Sold by
Centex Homes Minnesota Division
Bought by
Buchholtz Christopher M
Create a Home Valuation Report for This Property
The Home Valuation Report is an in-depth analysis detailing your home's value as well as a comparison with similar homes in the area
Home Values in the Area
Average Home Value in this Area
Purchase History
| Date | Buyer | Sale Price | Title Company |
|---|---|---|---|
| Mast Andrew | $430,000 | All American Title Company | |
| Louden Sarah | $339,000 | Liberty Title Inc | |
| Buchholtz Christopher M | $382,820 | -- |
Source: Public Records
Mortgage History
| Date | Status | Borrower | Loan Amount |
|---|---|---|---|
| Open | Mast Andrew | $387,000 | |
| Previous Owner | Louden Sarah | $327,635 |
Source: Public Records
Tax History Compared to Growth
Tax History
| Year | Tax Paid | Tax Assessment Tax Assessment Total Assessment is a certain percentage of the fair market value that is determined by local assessors to be the total taxable value of land and additions on the property. | Land | Improvement |
|---|---|---|---|---|
| 2024 | $6,716 | $528,600 | $128,100 | $400,500 |
| 2023 | $5,898 | $502,400 | $109,100 | $393,300 |
| 2022 | $5,298 | $532,500 | $131,000 | $401,500 |
| 2021 | $5,132 | $436,500 | $95,800 | $340,700 |
| 2020 | $5,265 | $415,800 | $85,800 | $330,000 |
| 2019 | $5,340 | $405,600 | $91,100 | $314,500 |
| 2018 | $4,953 | $389,500 | $93,100 | $296,400 |
| 2017 | $4,440 | $310,700 | $82,000 | $228,700 |
| 2016 | $4,644 | $319,500 | $98,000 | $221,500 |
| 2015 | $4,624 | $310,300 | $91,000 | $219,300 |
| 2014 | -- | $286,600 | $91,000 | $195,600 |
Source: Public Records
Map
Nearby Homes
- 6848 Troy Ln N
- 6757 Urbandale Ln N
- 6750 Troy Ln N
- 6647 Peony Ln N
- 6860 Peony Ln N
- 17812 66th Ave N
- 6540 Yellowstone Ln N
- 20144 68th Ave N
- 17673 69th Place N
- 6566 Merrimac Ln N
- 17716 Elm Rd N
- 6473 Merrimac Ln N
- 6508 Merrimac Ln N Unit 6508
- 17549 70th Place N
- 6300 Ranier Ln N
- 1988 Leaping Deer Cir
- 6205 Ranier Ln N
- 17390 72nd Ave N Unit 1301
- 17344 72nd Ave N Unit 1304
- 7156 Fir Ln N
- 6813 Troy Ln N
- 6797 Troy Ln N
- 6810 Urbandale Ln N
- 6794 Urbandale Ln N
- 6822 Urbandale Ln N
- 6782 Urbandale Ln N
- 6834 Urbandale Ln N
- 6781 Troy Ln N
- 6770 Urbandale Ln N
- 6812 Troy Ln N
- 6796 Troy Ln N
- 6758 Urbandale Ln N
- 6824 Troy Ln N
- 6773 Troy Ln N
- 6788 Troy Ln N
- 6746 Urbandale Ln N
- 6836 Troy Ln N
- 6734 Urbandale Ln N
- 6780 Troy Ln N
- 6765 Troy Ln N