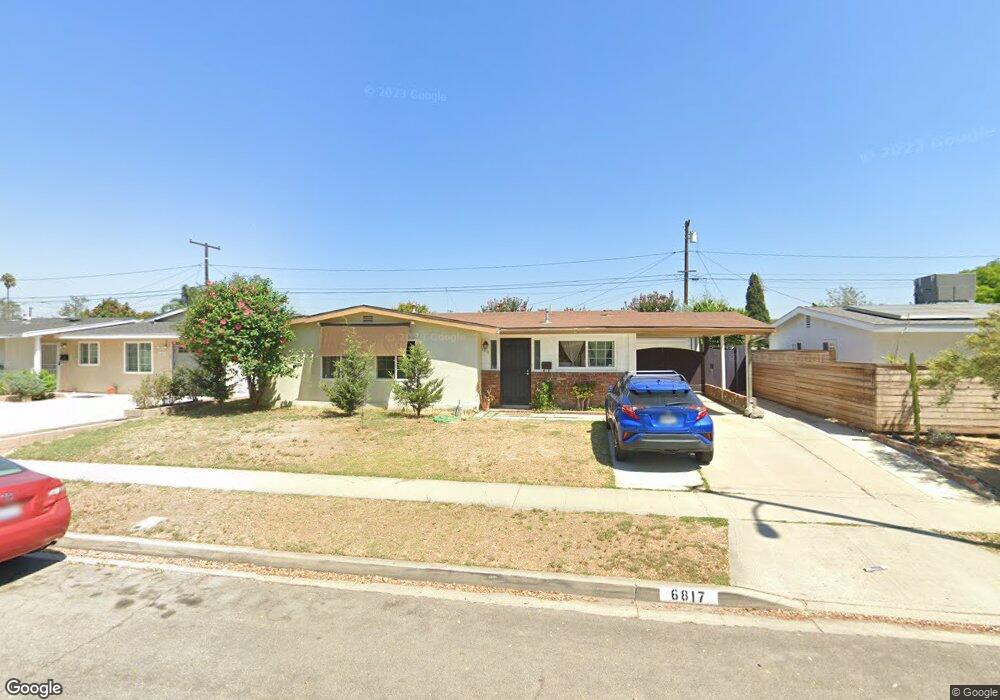
6817 E Almada St Long Beach, CA 90815
Atherton South NeighborhoodEstimated Value: $867,812 - $1,131,000
3
Beds
3
Baths
1,135
Sq Ft
$878/Sq Ft
Est. Value
About This Home
This home is located at 6817 E Almada St, Long Beach, CA 90815 and is currently estimated at $996,203, approximately $877 per square foot. 6817 E Almada St is a home located in Los Angeles County with nearby schools including Tincher Preparatory School, Woodrow Wilson High School, and Los Altos Grace Schools.
Ownership History
Date
Name
Owned For
Owner Type
Purchase Details
Closed on
Mar 20, 2010
Sold by
Keenan Kelly A
Bought by
Ngo Donald A
Current Estimated Value
Purchase Details
Closed on
Mar 15, 2010
Sold by
Truong Thuy T
Bought by
Ngo Christopher
Purchase Details
Closed on
Mar 9, 2010
Sold by
Dang Hai
Bought by
Ngo Hung A and Ngo Donald A
Purchase Details
Closed on
Dec 12, 2009
Sold by
Ngo Christopher and Ngo Donald A
Bought by
Dang Hai
Purchase Details
Closed on
Sep 9, 1993
Sold by
Ngo Ha Mong Thi
Bought by
Ngo Ha Mong Thi
Home Financials for this Owner
Home Financials are based on the most recent Mortgage that was taken out on this home.
Original Mortgage
$120,000
Interest Rate
7.2%
Purchase Details
Closed on
Aug 25, 1993
Sold by
Dang Hue and Dang Chau
Bought by
Ngo Ha Mong Thi
Home Financials for this Owner
Home Financials are based on the most recent Mortgage that was taken out on this home.
Original Mortgage
$120,000
Interest Rate
7.2%
Create a Home Valuation Report for This Property
The Home Valuation Report is an in-depth analysis detailing your home's value as well as a comparison with similar homes in the area
Home Values in the Area
Average Home Value in this Area
Purchase History
| Date | Buyer | Sale Price | Title Company |
|---|---|---|---|
| Ngo Donald A | -- | None Available | |
| Ngo Christopher | -- | None Available | |
| Ngo Hung A | -- | None Available | |
| Dang Hai | -- | None Available | |
| Ngo Ha Mong Thi | $33,500 | -- | |
| Ngo Ha Mong Thi | $170,000 | Fidelity National Title Ins |
Source: Public Records
Mortgage History
| Date | Status | Borrower | Loan Amount |
|---|---|---|---|
| Closed | Ngo Ha Mong Thi | $120,000 |
Source: Public Records
Tax History
| Year | Tax Paid | Tax Assessment Tax Assessment Total Assessment is a certain percentage of the fair market value that is determined by local assessors to be the total taxable value of land and additions on the property. | Land | Improvement |
|---|---|---|---|---|
| 2025 | $3,996 | $293,636 | $182,060 | $111,576 |
| 2024 | $3,996 | $287,880 | $178,491 | $109,389 |
| 2023 | $3,936 | $282,237 | $174,992 | $107,245 |
| 2022 | $3,707 | $276,704 | $171,561 | $105,143 |
| 2021 | $3,637 | $271,280 | $168,198 | $103,082 |
| 2019 | $3,585 | $263,236 | $163,210 | $100,026 |
| 2018 | $3,402 | $258,075 | $160,010 | $98,065 |
| 2016 | $3,127 | $248,056 | $153,798 | $94,258 |
| 2015 | $3,005 | $244,331 | $151,488 | $92,843 |
| 2014 | $2,988 | $239,546 | $148,521 | $91,025 |
Source: Public Records
Map
Nearby Homes
- 6841 E Bacarro St
- 6911 E 10th St
- 6976 E El Cedral St
- 1016 Palo Verde Ave
- 1821 Ostrom Ave
- 1837 N Studebaker Rd
- 173 College Park Dr
- 105 Harvard Ln
- 715 N Lariat Cir
- 1881 Hackett Ave
- 1075 Brookline Rd
- 6200 Riviera Cir
- 2024 Shipway Ave
- 2692 Salmon Dr
- 1240 Scioto Rd Unit 228F
- 2050 Josie Ave
- 13121 Oak Hills Dr Unit 233J
- 13180 Nassau Dr Unit 210D
- 2671 Saint Albans Dr
- 13101 Oak Hills Dr
- 6823 E Almada St
- 6811 E Almada St
- 6814 E Mantova St
- 6820 E Mantova St
- 6808 E Mantova St
- 6829 E Almada St
- 6803 E Almada St
- 6828 E Mantova St
- 6802 E Mantova St
- 6820 E Almada St
- 6814 E Almada St
- 6828 E Almada St
- 6835 E Almada St
- 6808 E Almada St
- 6749 E Almada St
- 6834 E Mantova St
- 6748 E Mantova St
- 6802 E Almada St
- 6834 E Almada St
- 6815 E Mantova St
Your Personal Tour Guide
Ask me questions while you tour the home.