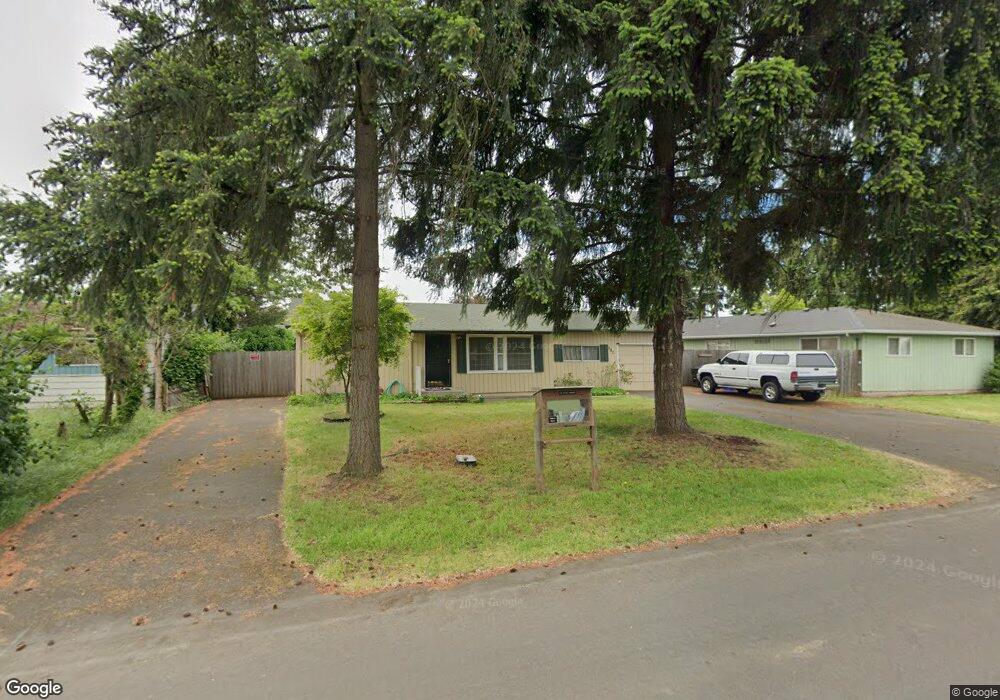
682 Bushnell Ln Eugene, OR 97404
River Road NeighborhoodEstimated Value: $309,017 - $346,000
2
Beds
1
Bath
999
Sq Ft
$330/Sq Ft
Est. Value
About This Home
This home is located at 682 Bushnell Ln, Eugene, OR 97404 and is currently estimated at $330,004, approximately $330 per square foot. 682 Bushnell Ln is a home located in Lane County with nearby schools including Irving Elementary School, Shasta Middle School, and Willamette High School.
Ownership History
Date
Name
Owned For
Owner Type
Purchase Details
Closed on
Aug 16, 2016
Sold by
Quartararo Kathleen Hanson
Bought by
Quartararo Michael
Current Estimated Value
Purchase Details
Closed on
Sep 14, 2011
Sold by
Quartararo Michael J
Bought by
Quartararo Kathy Hanson and Quartararo Michael J
Purchase Details
Closed on
Jul 12, 2006
Sold by
Odell Darcey and Thomas Diana
Bought by
Quartararo Michael J
Home Financials for this Owner
Home Financials are based on the most recent Mortgage that was taken out on this home.
Original Mortgage
$100,000
Outstanding Balance
$58,138
Interest Rate
6.66%
Mortgage Type
Purchase Money Mortgage
Estimated Equity
$271,866
Purchase Details
Closed on
Feb 27, 2003
Sold by
Odell Darcey
Bought by
Smith Harriett Elaine
Purchase Details
Closed on
Aug 17, 2000
Sold by
Smith Branson
Bought by
Smith J Branson and J Branson Smith Revocable Living Trust
Purchase Details
Closed on
May 12, 1998
Sold by
Va
Bought by
Smith Branson and Smith Harriett E
Create a Home Valuation Report for This Property
The Home Valuation Report is an in-depth analysis detailing your home's value as well as a comparison with similar homes in the area
Home Values in the Area
Average Home Value in this Area
Purchase History
| Date | Buyer | Sale Price | Title Company |
|---|---|---|---|
| Quartararo Michael | -- | None Available | |
| Quartararo Kathy Hanson | -- | Cascade Title Company | |
| Quartararo Michael J | $150,000 | Cascade Title Co | |
| Smith Harriett Elaine | -- | American Title Group | |
| Smith J Branson | -- | -- | |
| Smith Branson | -- | Key Title Company |
Source: Public Records
Mortgage History
| Date | Status | Borrower | Loan Amount |
|---|---|---|---|
| Open | Quartararo Michael J | $100,000 |
Source: Public Records
Tax History
| Year | Tax Paid | Tax Assessment Tax Assessment Total Assessment is a certain percentage of the fair market value that is determined by local assessors to be the total taxable value of land and additions on the property. | Land | Improvement |
|---|---|---|---|---|
| 2025 | $2,005 | $136,309 | -- | -- |
| 2024 | $1,954 | $132,339 | -- | -- |
| 2023 | $1,954 | $128,485 | -- | -- |
| 2022 | $1,825 | $124,743 | $0 | $0 |
| 2021 | $1,780 | $121,110 | $0 | $0 |
| 2020 | $1,724 | $117,583 | $0 | $0 |
| 2019 | $1,632 | $114,159 | $0 | $0 |
| 2018 | $1,580 | $107,606 | $0 | $0 |
| 2017 | $1,524 | $107,606 | $0 | $0 |
| 2016 | $1,481 | $104,472 | $0 | $0 |
| 2015 | $1,461 | $101,429 | $0 | $0 |
| 2014 | $1,474 | $98,475 | $0 | $0 |
Source: Public Records
Map
Nearby Homes
- 1384 David Ave
- 2418 Kalmia St
- 2488 Northampton
- 0 Pacific Hwy W
- 2580 Crowther Dr
- 805 Impala Ave
- 2610 Crowther Dr
- 1755 Brentwood Ave
- 3906 Century Dr
- 2563 York St
- 1682 Hemlock St
- 3717 Riviera
- 2740 Stark St
- 2931 Shelby Way
- 4114 Jessen Dr
- 1566 Maywood Ave
- 2721 La Darrah St
- 2987 Dry Creek Rd
- 4214 Heins Ct
- 4043 Wagner St
- 674 Bushnell Ln
- 2083 Smithoak St
- 2013 Smithoak St
- 2043 Smithoak St
- 660 Bushnell Ln
- 675 Bushnell Ln
- 681 Bushnell Ln
- 1995 Smithoak St
- 11 Smithoak St
- 12 Smithoak St
- 10 Smithoak St
- 0 Smithoak St Unit 8053860
- 1 Smithoak St
- 0 Smithoak St Unit 8096057
- 6 Smithoak St
- 5 Smithoak St
- 4 Smithoak St
- 3 Smithoak St
- 2 Smithoak St
- 0 Smithoak St Unit 3 9031731
Your Personal Tour Guide
Ask me questions while you tour the home.