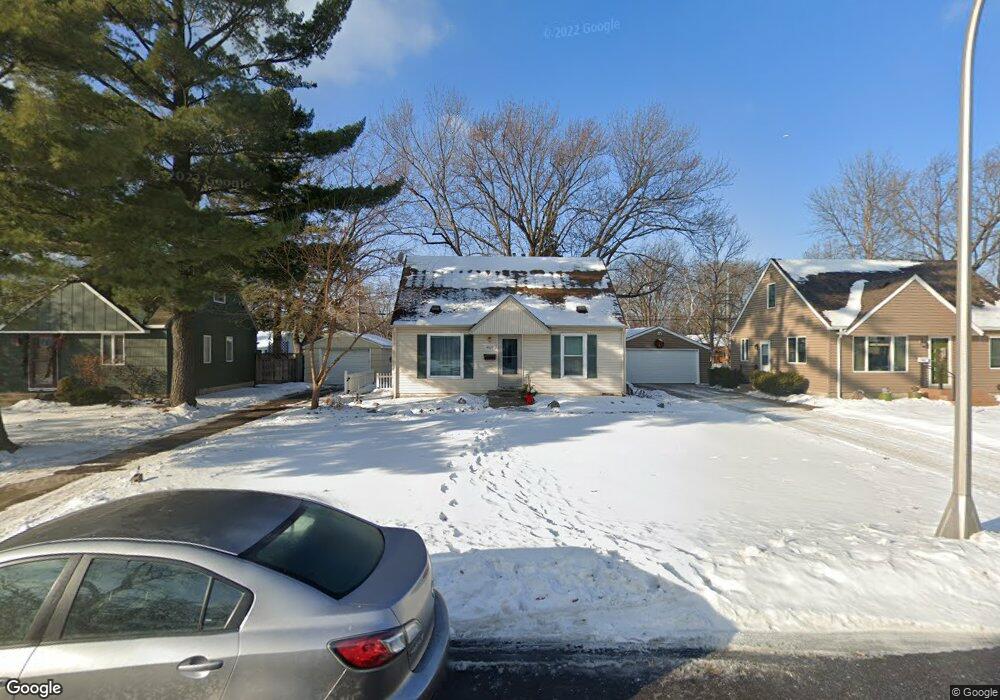
6820 Columbus Ave S Richfield, MN 55423
Estimated Value: $321,000 - $352,000
3
Beds
1
Bath
960
Sq Ft
$346/Sq Ft
Est. Value
About This Home
This home is located at 6820 Columbus Ave S, Richfield, MN 55423 and is currently estimated at $332,095, approximately $345 per square foot. 6820 Columbus Ave S is a home located in Hennepin County with nearby schools including Centennial Elementary School, Richfield Middle School, and Partnership Academy Inc..
Ownership History
Date
Name
Owned For
Owner Type
Purchase Details
Closed on
May 2, 2016
Sold by
185 Group Llc
Bought by
Piehler Mason K
Current Estimated Value
Home Financials for this Owner
Home Financials are based on the most recent Mortgage that was taken out on this home.
Original Mortgage
$193,019
Outstanding Balance
$151,571
Interest Rate
3.25%
Mortgage Type
FHA
Estimated Equity
$180,524
Purchase Details
Closed on
Sep 1, 2011
Sold by
Federal National Mortgage Association
Bought by
Selden Matthew
Home Financials for this Owner
Home Financials are based on the most recent Mortgage that was taken out on this home.
Original Mortgage
$74,680
Interest Rate
4.4%
Mortgage Type
New Conventional
Purchase Details
Closed on
Aug 12, 2010
Sold by
Cutler Robin T
Bought by
Citimortgage Inc
Purchase Details
Closed on
Jun 22, 2007
Sold by
Matthies Mark
Bought by
Cutler Robin and Klaers Robert
Purchase Details
Closed on
Oct 24, 2003
Sold by
Ready Michael D
Bought by
Matthies Mark
Purchase Details
Closed on
Mar 23, 2001
Sold by
Devilliers Vernee Chanda
Bought by
Ready Michael
Create a Home Valuation Report for This Property
The Home Valuation Report is an in-depth analysis detailing your home's value as well as a comparison with similar homes in the area
Home Values in the Area
Average Home Value in this Area
Purchase History
| Date | Buyer | Sale Price | Title Company |
|---|---|---|---|
| Piehler Mason K | $196,600 | Title One Inc | |
| Selden Matthew | -- | Custom Title Services Llc | |
| Citimortgage Inc | $212,329 | -- | |
| Cutler Robin | $203,100 | -- | |
| Matthies Mark | $180,000 | -- | |
| Ready Michael | $142,500 | -- |
Source: Public Records
Mortgage History
| Date | Status | Borrower | Loan Amount |
|---|---|---|---|
| Open | Piehler Mason K | $193,019 | |
| Previous Owner | Selden Matthew | $74,680 |
Source: Public Records
Tax History Compared to Growth
Tax History
| Year | Tax Paid | Tax Assessment Tax Assessment Total Assessment is a certain percentage of the fair market value that is determined by local assessors to be the total taxable value of land and additions on the property. | Land | Improvement |
|---|---|---|---|---|
| 2024 | $4,031 | $293,200 | $115,200 | $178,000 |
| 2023 | $3,948 | $292,300 | $112,500 | $179,800 |
| 2022 | $3,414 | $293,000 | $119,000 | $174,000 |
| 2021 | $3,174 | $250,000 | $98,000 | $152,000 |
| 2020 | $3,126 | $232,000 | $86,000 | $146,000 |
| 2019 | $3,064 | $220,000 | $86,000 | $134,000 |
| 2018 | $2,822 | $212,000 | $82,000 | $130,000 |
| 2017 | $2,115 | $159,000 | $58,000 | $101,000 |
| 2016 | $2,552 | $156,000 | $61,000 | $95,000 |
| 2015 | $2,439 | $151,000 | $56,000 | $95,000 |
| 2014 | -- | $143,000 | $62,000 | $81,000 |
Source: Public Records
Map
Nearby Homes
- 6829 Elliot Ave S
- 6739 Elliot Ave S
- 6810 11th Ave S
- 6617 Park Ave
- 6721 13th Ave S
- 7145 Columbus Ave
- 7145 12th Ave S
- 7300 Park Ave
- 7128 3rd Ave S
- 6525 14th Ave S
- 7301 Portland Ave
- 7235 4th Ave S
- 7221 Clinton Ave
- 6715 Bloomington Ave
- 7133 2nd Ave S
- 6933 Nicollet Ave
- 6526 Bloomington Ave
- 7326 11th Ave S
- 6533 Bloomington Ave
- 6345 13th Ave S
- 6820 Columbus Ave
- 6824 Columbus Ave
- 6814 Columbus Ave
- 6828 Columbus Ave
- 6808 Columbus Ave
- 6821 Park Ave
- 6815 Park Ave
- 6825 Park Ave
- 6830 Columbus Ave
- 6809 Park Ave
- 709 E 68th St
- 6821 Columbus Ave
- 6827 Columbus Ave
- 6833 Park Ave
- 6809 Columbus Ave
- 701 E 68th St
- 6832 Columbus Ave
- 6832 Columbus Ave S
- 6833 Columbus Ave
- 721 E 68th St