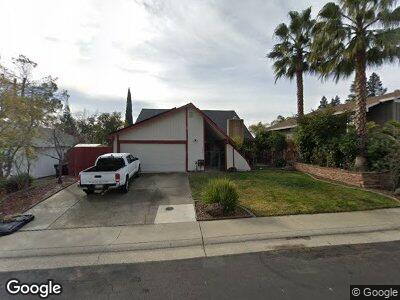
6820 Sugar Maple Way Citrus Heights, CA 95610
Estimated Value: $597,000 - $621,000
5
Beds
3
Baths
2,316
Sq Ft
$262/Sq Ft
Est. Value
About This Home
This home is located at 6820 Sugar Maple Way, Citrus Heights, CA 95610 and is currently estimated at $607,311, approximately $262 per square foot. 6820 Sugar Maple Way is a home located in Sacramento County with nearby schools including Kingswood K-8, San Juan High School, and Country Hill Montessori School.
Ownership History
Date
Name
Owned For
Owner Type
Purchase Details
Closed on
Aug 7, 2002
Sold by
Bennett Dean A and Bennett Angela
Bought by
Seljak Boris and Seljak Nevena
Current Estimated Value
Home Financials for this Owner
Home Financials are based on the most recent Mortgage that was taken out on this home.
Original Mortgage
$225,720
Interest Rate
6.51%
Purchase Details
Closed on
Sep 2, 1999
Sold by
Laflam Therese D
Bought by
Bennett Dean A and Bennett Angela
Home Financials for this Owner
Home Financials are based on the most recent Mortgage that was taken out on this home.
Original Mortgage
$148,050
Interest Rate
10.25%
Purchase Details
Closed on
Oct 13, 1995
Sold by
Laflam Therese D
Bought by
Laflam Therese D
Create a Home Valuation Report for This Property
The Home Valuation Report is an in-depth analysis detailing your home's value as well as a comparison with similar homes in the area
Home Values in the Area
Average Home Value in this Area
Purchase History
| Date | Buyer | Sale Price | Title Company |
|---|---|---|---|
| Seljak Boris | $285,000 | North American Title Co | |
| Bennett Dean A | $164,500 | Chicago Title Co | |
| Laflam Therese D | -- | -- |
Source: Public Records
Mortgage History
| Date | Status | Borrower | Loan Amount |
|---|---|---|---|
| Open | Seljak Boris | $270,000 | |
| Closed | Seljak Boris | $249,400 | |
| Closed | Seljak Boris | $50,000 | |
| Closed | Seljak Boris | $277,000 | |
| Closed | Seljak Boris | $48,744 | |
| Closed | Seljak Boris | $40,000 | |
| Closed | Seljak Boris | $228,000 | |
| Closed | Seljak Boris | $225,720 | |
| Previous Owner | Bennett Dean A | $184,730 | |
| Previous Owner | Bennett Dean A | $148,050 |
Source: Public Records
Tax History Compared to Growth
Tax History
| Year | Tax Paid | Tax Assessment Tax Assessment Total Assessment is a certain percentage of the fair market value that is determined by local assessors to be the total taxable value of land and additions on the property. | Land | Improvement |
|---|---|---|---|---|
| 2024 | $4,773 | $402,631 | $70,982 | $331,649 |
| 2023 | $4,651 | $394,738 | $69,591 | $325,147 |
| 2022 | $4,625 | $386,999 | $68,227 | $318,772 |
| 2021 | $4,547 | $379,412 | $66,890 | $312,522 |
| 2020 | $4,461 | $375,523 | $66,205 | $309,318 |
| 2019 | $4,370 | $368,160 | $64,907 | $303,253 |
| 2018 | $4,316 | $360,942 | $63,635 | $297,307 |
| 2017 | $4,275 | $353,866 | $62,388 | $291,478 |
| 2016 | $3,992 | $346,928 | $61,165 | $285,763 |
| 2015 | $3,612 | $315,000 | $52,500 | $262,500 |
| 2014 | $3,433 | $318,347 | $56,128 | $262,219 |
Source: Public Records
Map
Nearby Homes
- 6704 Green Ash Ct
- 6928 Trovita Way
- 7975 Arcade Lake Ln
- 7921 Arcade Lake Ln Unit 6
- 8019 Arcade Lake Ln
- 8032 Arcade Lake Ln
- 6736 Wyatt Cir
- 6732 Wyatt Cir
- 6724 Wyatt Cir
- 6720 Wyatt Cir
- 7864 Sunrise Terrace Ln
- 8059 Camstock Ct
- 8070 Camstock Ct
- 6935 W Oak Ct
- 6525 Sunrise Blvd Unit 5
- 6525 Sunrise Blvd Unit 73
- 7080 Canelo Hills Dr
- 6256 Jennie Alley
- 8100 Ramwood Way
- 7177 Canelo Hills Dr
- 6820 Sugar Maple Way
- 6824 Sugar Maple Way
- 6814 Sugar Maple Way
- 6712 Canoe Birch Ct
- 6716 Canoe Birch Ct
- 6828 Sugar Maple Way
- 6821 Sugar Maple Way
- 6817 Sugar Maple Way
- 6708 Canoe Birch Ct
- 6720 Canoe Birch Ct
- 6825 Sugar Maple Way
- 6836 Sugar Maple Way
- 6813 Sugar Maple Way
- 6804 Sugar Maple Way
- 6829 Sugar Maple Way
- 6809 Sugar Maple Way
- 6724 Canoe Birch Ct
- 6704 Canoe Birch Ct
- 6848 Sugar Maple Way
- 6800 Sugar Maple Way