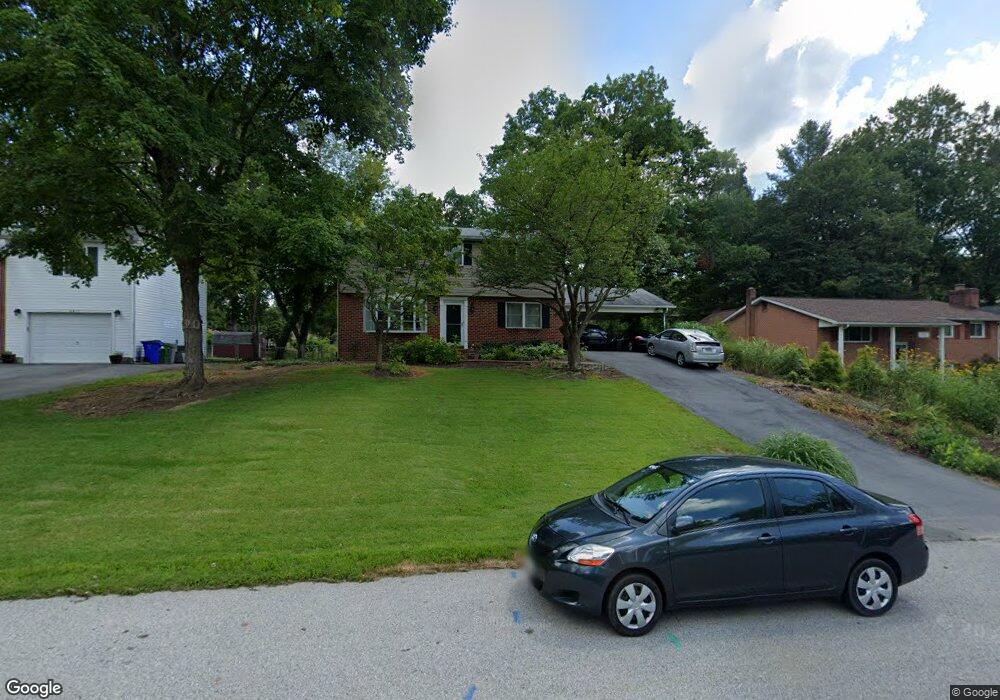
6821 Allview Dr Columbia, MD 21046
Kings Contrivance NeighborhoodEstimated Value: $574,850 - $618,000
5
Beds
4
Baths
1,890
Sq Ft
$318/Sq Ft
Est. Value
About This Home
This home is located at 6821 Allview Dr, Columbia, MD 21046 and is currently estimated at $600,463, approximately $317 per square foot. 6821 Allview Dr is a home located in Howard County with nearby schools including Atholton Elementary School, Oakland Mills Middle School, and Oakland Mills High School.
Ownership History
Date
Name
Owned For
Owner Type
Purchase Details
Closed on
Aug 28, 2020
Sold by
Strickland Mark R and Strickland Kimberly B
Bought by
Strickland Mark R and Strickland Kimberly B
Current Estimated Value
Purchase Details
Closed on
Oct 5, 2005
Sold by
Lee April C T
Bought by
Strickland Mark R and Strickland Kimberly
Home Financials for this Owner
Home Financials are based on the most recent Mortgage that was taken out on this home.
Original Mortgage
$359,650
Outstanding Balance
$192,744
Interest Rate
5.78%
Mortgage Type
New Conventional
Estimated Equity
$407,719
Purchase Details
Closed on
Jan 31, 2001
Sold by
Lunn Maurice A
Bought by
Lee April C T
Purchase Details
Closed on
Jan 26, 1981
Sold by
Ilves Hillar and Ilves Wf
Bought by
Lunn Maurice A
Home Financials for this Owner
Home Financials are based on the most recent Mortgage that was taken out on this home.
Original Mortgage
$69,500
Interest Rate
14.85%
Create a Home Valuation Report for This Property
The Home Valuation Report is an in-depth analysis detailing your home's value as well as a comparison with similar homes in the area
Home Values in the Area
Average Home Value in this Area
Purchase History
| Date | Buyer | Sale Price | Title Company |
|---|---|---|---|
| Strickland Mark R | -- | None Available | |
| Strickland Mark R | $499,900 | -- | |
| Lee April C T | $201,000 | -- | |
| Lunn Maurice A | $86,900 | -- |
Source: Public Records
Mortgage History
| Date | Status | Borrower | Loan Amount |
|---|---|---|---|
| Open | Strickland Mark R | $359,650 | |
| Closed | Strickland Mark R | $115,000 | |
| Previous Owner | Lunn Maurice A | $69,500 | |
| Closed | Lee April C T | -- |
Source: Public Records
Tax History Compared to Growth
Tax History
| Year | Tax Paid | Tax Assessment Tax Assessment Total Assessment is a certain percentage of the fair market value that is determined by local assessors to be the total taxable value of land and additions on the property. | Land | Improvement |
|---|---|---|---|---|
| 2025 | $6,792 | $455,300 | $237,300 | $218,000 |
| 2024 | $6,792 | $433,333 | $0 | $0 |
| 2023 | $6,335 | $411,367 | $0 | $0 |
| 2022 | $6,010 | $389,400 | $197,300 | $192,100 |
| 2021 | $5,705 | $378,767 | $0 | $0 |
| 2020 | $5,705 | $368,133 | $0 | $0 |
| 2019 | $5,552 | $357,500 | $154,300 | $203,200 |
| 2018 | $5,178 | $351,900 | $0 | $0 |
| 2017 | $5,083 | $357,500 | $0 | $0 |
| 2016 | -- | $340,700 | $0 | $0 |
| 2015 | -- | $335,400 | $0 | $0 |
| 2014 | -- | $330,100 | $0 | $0 |
Source: Public Records
Map
Nearby Homes
- 6725 Pine Dr
- 6722 Seneca Dr
- 7484 Sea Change
- 7356 Broken Staff
- 6712 Quiet Hours
- 7453 Hickory Log Cir
- 7374 Hickory Log Cir
- 6704 Second Morning Ct
- 10145 Goodin Cir
- 7331 Kerry Hill Ct
- 7258 Dockside Ln
- 10153 Cape Ann Dr
- 7245 Riding Hood Cir
- 7243 Riding Hood Cir
- 6426 Beechwood Dr
- 7172 Attic Window Way
- 7136 Fountain Rock Way
- 7329 Better Hours Ct
- 6556 Frietchie Row
- 8617 Sassafras Ct
- 6817 Allview Dr
- 6825 Allview Dr
- 6813 Allview Dr
- 6818 Carlinda Ave
- 6831 Allview Dr
- 6812 Carlinda Ave
- 6822 Carlinda Ave
- 6810 Carlinda Ave
- 6822 Allview Dr
- 6818 Allview Dr
- 6826 Allview Dr
- 6814 Allview Dr
- 6749 Pine Dr
- 6835 Allview Dr
- 6826 Carlinda Ave
- 6809 Allview Dr
- 6808 Carlinda Ave
- 6810 Allview Dr
- 6830 Allview Dr
- 6745 Pine Dr