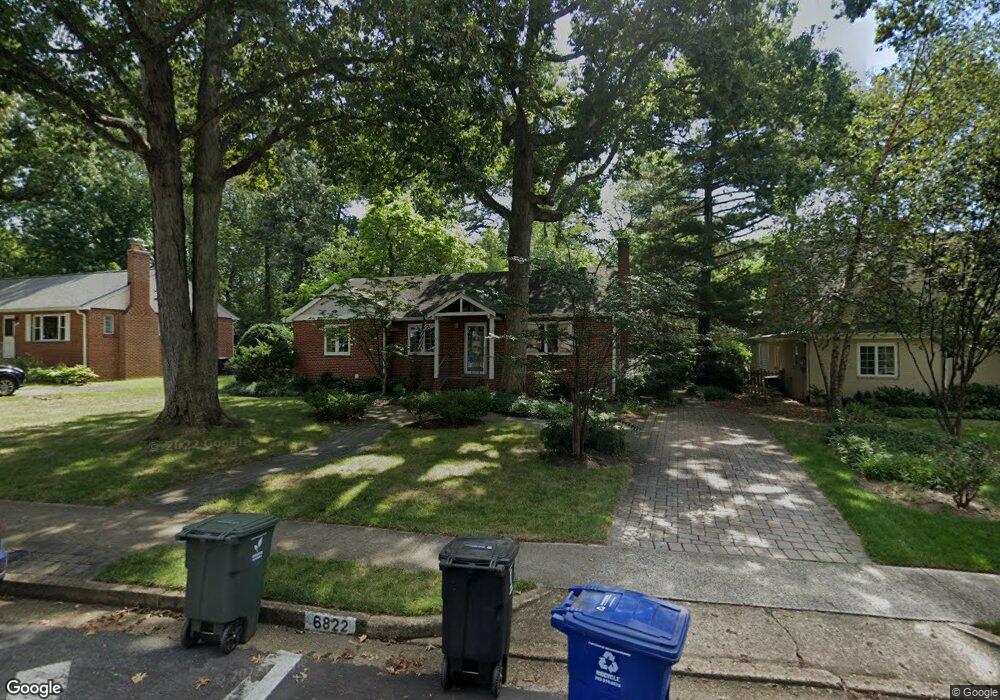
6822 29th St N Arlington, VA 22213
East Falls Church NeighborhoodEstimated Value: $1,313,217 - $1,517,000
4
Beds
3
Baths
3,415
Sq Ft
$406/Sq Ft
Est. Value
About This Home
This home is located at 6822 29th St N, Arlington, VA 22213 and is currently estimated at $1,384,804, approximately $405 per square foot. 6822 29th St N is a home located in Arlington County with nearby schools including Tuckahoe Elementary School, Williamsburg Middle School, and Yorktown High School.
Ownership History
Date
Name
Owned For
Owner Type
Purchase Details
Closed on
May 12, 2025
Sold by
Rudman Andrew Isaac and Rudman Judith Wey
Bought by
Andrew I And Judith Wey Rudman Revocable Trus and Rudman
Current Estimated Value
Purchase Details
Closed on
Aug 29, 2016
Sold by
The Andrew Isaac Rudman Revocable Living
Bought by
Rudman Andrew Isaac and Rudman Judith Wey
Home Financials for this Owner
Home Financials are based on the most recent Mortgage that was taken out on this home.
Original Mortgage
$391,300
Interest Rate
2.63%
Mortgage Type
New Conventional
Purchase Details
Closed on
Oct 28, 1996
Sold by
Tatum Robert W and Tatum Susan D
Bought by
Rudman Andrew I and Rudman Judith W
Home Financials for this Owner
Home Financials are based on the most recent Mortgage that was taken out on this home.
Original Mortgage
$188,000
Interest Rate
8.22%
Mortgage Type
New Conventional
Create a Home Valuation Report for This Property
The Home Valuation Report is an in-depth analysis detailing your home's value as well as a comparison with similar homes in the area
Home Values in the Area
Average Home Value in this Area
Purchase History
| Date | Buyer | Sale Price | Title Company |
|---|---|---|---|
| Andrew I And Judith Wey Rudman Revocable Trus | -- | None Listed On Document | |
| Rudman Andrew Isaac | -- | None Available | |
| Rudman Andrew I | $235,000 | -- |
Source: Public Records
Mortgage History
| Date | Status | Borrower | Loan Amount |
|---|---|---|---|
| Previous Owner | Rudman Andrew Isaac | $391,300 | |
| Previous Owner | Rudman Andrew I | $188,000 |
Source: Public Records
Tax History Compared to Growth
Tax History
| Year | Tax Paid | Tax Assessment Tax Assessment Total Assessment is a certain percentage of the fair market value that is determined by local assessors to be the total taxable value of land and additions on the property. | Land | Improvement |
|---|---|---|---|---|
| 2025 | $12,219 | $1,182,900 | $974,900 | $208,000 |
| 2024 | $11,486 | $1,111,900 | $929,900 | $182,000 |
| 2023 | $11,261 | $1,093,300 | $914,900 | $178,400 |
| 2022 | $10,871 | $1,055,400 | $869,900 | $185,500 |
| 2021 | $10,296 | $999,600 | $814,100 | $185,500 |
| 2020 | $9,875 | $962,500 | $779,100 | $183,400 |
| 2019 | $9,568 | $932,600 | $755,600 | $177,000 |
| 2018 | $9,053 | $899,900 | $736,000 | $163,900 |
| 2017 | $8,965 | $891,200 | $707,300 | $183,900 |
| 2016 | $8,219 | $829,400 | $655,500 | $173,900 |
| 2015 | $7,834 | $786,500 | $626,800 | $159,700 |
| 2014 | $7,462 | $749,200 | $569,300 | $179,900 |
Source: Public Records
Map
Nearby Homes
- 2828 N Van Buren St
- 6607 29th St N
- 3019 N Tuckahoe St
- 2302 Westmoreland St
- 6587 29th St N
- 3013 N Toronto St
- 6601 Gordon Ave
- 2231 N Tuckahoe St
- 2300 Meridian St
- 2632 N Sycamore St
- 6613 Fisher Ave
- 2315 N Tuckahoe St
- 2221 Orchid Dr
- 6616 Fisher Ave
- 6701 Washington Blvd Unit B
- 2200 N Westmoreland St Unit 516
- 2200 N Westmoreland St Unit 202
- 6316 26th St N
- 6703 Hallwood Ave
- 6707 Hallwood Ave
- 6816 29th St N
- 6828 29th St N
- 6810 29th St N
- 2831 N Westmoreland St
- 6827 28th St N
- 2821 N Westmoreland St
- 6817 28th St N
- 6833 28th St N
- 6825 29th St N
- 6819 29th St N
- 0 28th St N Unit AR8225232
- 6815 28th St N
- 6831 29th St N
- 2811 N Westmoreland St
- 2820 N Van Buren St
- 6813 29th St N
- 2814 N Van Buren St
- 6837 29th St N
- 6809 28th St N
- 2801 N Westmoreland St