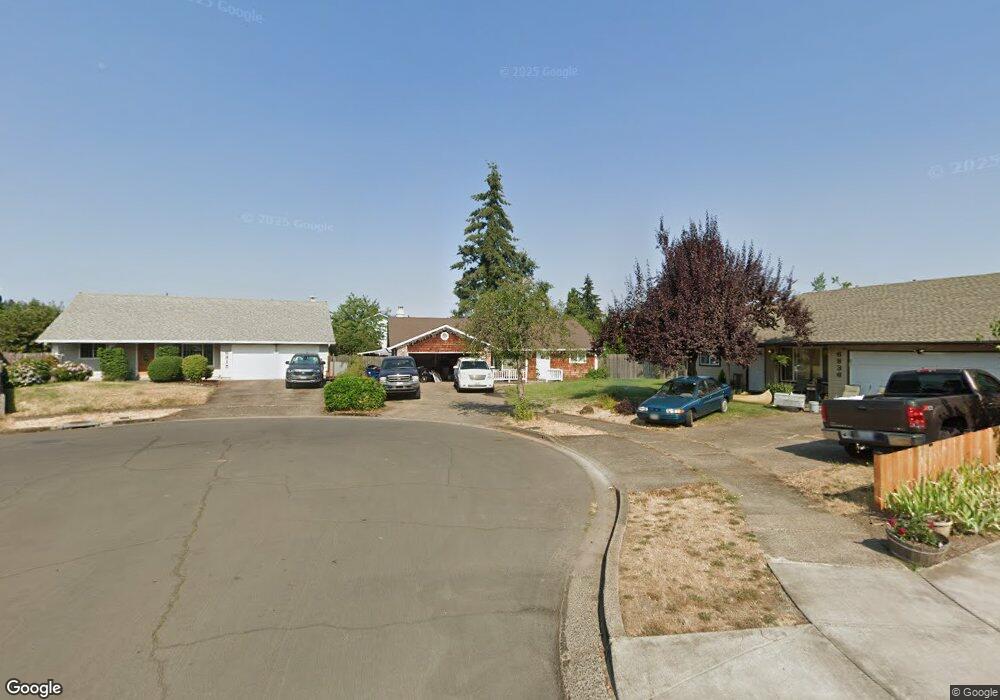
6822 B St Springfield, OR 97478
Thurston NeighborhoodEstimated Value: $394,578 - $469,000
3
Beds
2
Baths
1,223
Sq Ft
$350/Sq Ft
Est. Value
About This Home
This home is located at 6822 B St, Springfield, OR 97478 and is currently estimated at $428,645, approximately $350 per square foot. 6822 B St is a home located in Lane County with nearby schools including Ridgeview Elementary School, Thurston Middle School, and Thurston High School.
Ownership History
Date
Name
Owned For
Owner Type
Purchase Details
Closed on
Mar 6, 2015
Sold by
Jojola Gilbert T and Jojola Nancy P
Bought by
Harmony Rentals Llc
Current Estimated Value
Purchase Details
Closed on
Sep 10, 2008
Sold by
Henley Timothy W
Bought by
Jojola Gilbert T and Jojola Nancy P
Home Financials for this Owner
Home Financials are based on the most recent Mortgage that was taken out on this home.
Original Mortgage
$165,250
Interest Rate
6.5%
Mortgage Type
Purchase Money Mortgage
Create a Home Valuation Report for This Property
The Home Valuation Report is an in-depth analysis detailing your home's value as well as a comparison with similar homes in the area
Home Values in the Area
Average Home Value in this Area
Purchase History
| Date | Buyer | Sale Price | Title Company |
|---|---|---|---|
| Harmony Rentals Llc | $129,200 | None Available | |
| Jojola Gilbert T | $217,250 | First American Title |
Source: Public Records
Mortgage History
| Date | Status | Borrower | Loan Amount |
|---|---|---|---|
| Previous Owner | Jojola Gilbert T | $165,250 |
Source: Public Records
Tax History Compared to Growth
Tax History
| Year | Tax Paid | Tax Assessment Tax Assessment Total Assessment is a certain percentage of the fair market value that is determined by local assessors to be the total taxable value of land and additions on the property. | Land | Improvement |
|---|---|---|---|---|
| 2025 | $3,571 | $194,730 | -- | -- |
| 2024 | $3,513 | $189,059 | -- | -- |
| 2023 | $3,513 | $183,553 | $0 | $0 |
| 2022 | $3,254 | $178,207 | $0 | $0 |
| 2021 | $3,195 | $173,017 | $0 | $0 |
| 2020 | $3,102 | $167,978 | $0 | $0 |
| 2019 | $3,009 | $163,086 | $0 | $0 |
| 2018 | $2,836 | $153,724 | $0 | $0 |
| 2017 | $2,727 | $153,724 | $0 | $0 |
| 2016 | $2,670 | $149,247 | $0 | $0 |
| 2015 | $2,594 | $144,900 | $0 | $0 |
| 2014 | $2,555 | $140,680 | $0 | $0 |
Source: Public Records
Map
Nearby Homes
- 250 68th St
- 6887 B St
- 6981 Main St
- 296 S 68th Ct
- 353 71st St
- 0 71st St
- 6964 Bluebelle Way
- 353 72nd St
- 0 S 67th St Unit 693960327
- 595 S 68th Place
- 6808 Moses Pass
- 0 Omlid Dr Unit 1 706471345
- 0 Omlid Dr Unit 27 796722689
- 0 Omlid Dr Unit 26 256458253
- 0 Omlid Dr Unit 3 154724851
- 0 Omlid Dr Unit 2 312357104
- 7080 Thurston Rd Unit 2
- 320 Mountaingate Dr
- 0 S 69th Place
- 0 Forest Ridge Unit 520732026