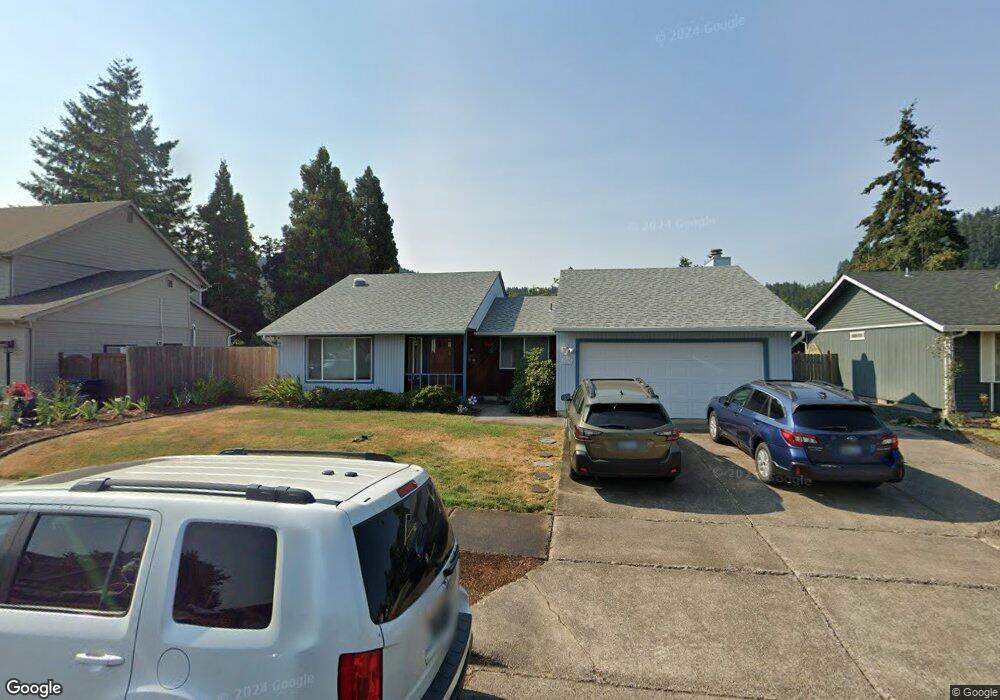
6823 C St Springfield, OR 97478
Thurston NeighborhoodEstimated Value: $444,089 - $522,000
3
Beds
2
Baths
1,691
Sq Ft
$280/Sq Ft
Est. Value
About This Home
This home is located at 6823 C St, Springfield, OR 97478 and is currently estimated at $473,522, approximately $280 per square foot. 6823 C St is a home located in Lane County with nearby schools including Ridgeview Elementary School, Thurston Middle School, and Thurston High School.
Ownership History
Date
Name
Owned For
Owner Type
Purchase Details
Closed on
May 10, 2023
Sold by
Musgrove David W
Bought by
Musgrove Family Trust
Current Estimated Value
Purchase Details
Closed on
Oct 20, 1997
Sold by
Dahrens Michael R and Dahrens Judy A
Bought by
Musgrove David W and Musgrove Robin L
Home Financials for this Owner
Home Financials are based on the most recent Mortgage that was taken out on this home.
Original Mortgage
$123,424
Interest Rate
7.49%
Mortgage Type
VA
Create a Home Valuation Report for This Property
The Home Valuation Report is an in-depth analysis detailing your home's value as well as a comparison with similar homes in the area
Home Values in the Area
Average Home Value in this Area
Purchase History
| Date | Buyer | Sale Price | Title Company |
|---|---|---|---|
| Musgrove Family Trust | -- | None Listed On Document | |
| Musgrove David W | $128,000 | Western Pioneer Title Co |
Source: Public Records
Mortgage History
| Date | Status | Borrower | Loan Amount |
|---|---|---|---|
| Previous Owner | Musgrove David W | $123,424 |
Source: Public Records
Tax History
| Year | Tax Paid | Tax Assessment Tax Assessment Total Assessment is a certain percentage of the fair market value that is determined by local assessors to be the total taxable value of land and additions on the property. | Land | Improvement |
|---|---|---|---|---|
| 2025 | $4,593 | $250,467 | -- | -- |
| 2024 | $4,519 | $243,172 | -- | -- |
| 2023 | $4,519 | $236,090 | $0 | $0 |
| 2022 | $4,185 | $229,214 | $0 | $0 |
| 2021 | $4,110 | $222,538 | $0 | $0 |
| 2020 | $3,990 | $216,057 | $0 | $0 |
| 2019 | $3,870 | $209,765 | $0 | $0 |
| 2018 | $3,648 | $197,724 | $0 | $0 |
| 2017 | $3,508 | $197,724 | $0 | $0 |
| 2016 | $3,434 | $191,965 | $0 | $0 |
| 2015 | $3,336 | $186,374 | $0 | $0 |
| 2014 | $3,286 | $180,946 | $0 | $0 |
Source: Public Records
Map
Nearby Homes
- 250 68th St
- 353 71st St
- 555 66th St
- 6964 Bluebelle Way
- 0 71st St
- 6540 B St
- 6445 B St
- 6898 Thurston Rd
- 6451 Dogwood St
- 0 Omlid Dr Unit 1 706471345
- 0 Omlid Dr Unit 11
- 0 Omlid Dr Unit 27 796722689
- 0 Omlid Dr Unit 26 256458253
- 0 Omlid Dr Unit 10
- 0 Omlid Dr Unit 3 154724851
- 0 Omlid Dr Unit 2 312357104
- 6884 Forest Ridge Dr
- 0 S 69th Place
- 320 Mountaingate Dr
- 7080 Thurston Rd Unit 2
Your Personal Tour Guide
Ask me questions while you tour the home.