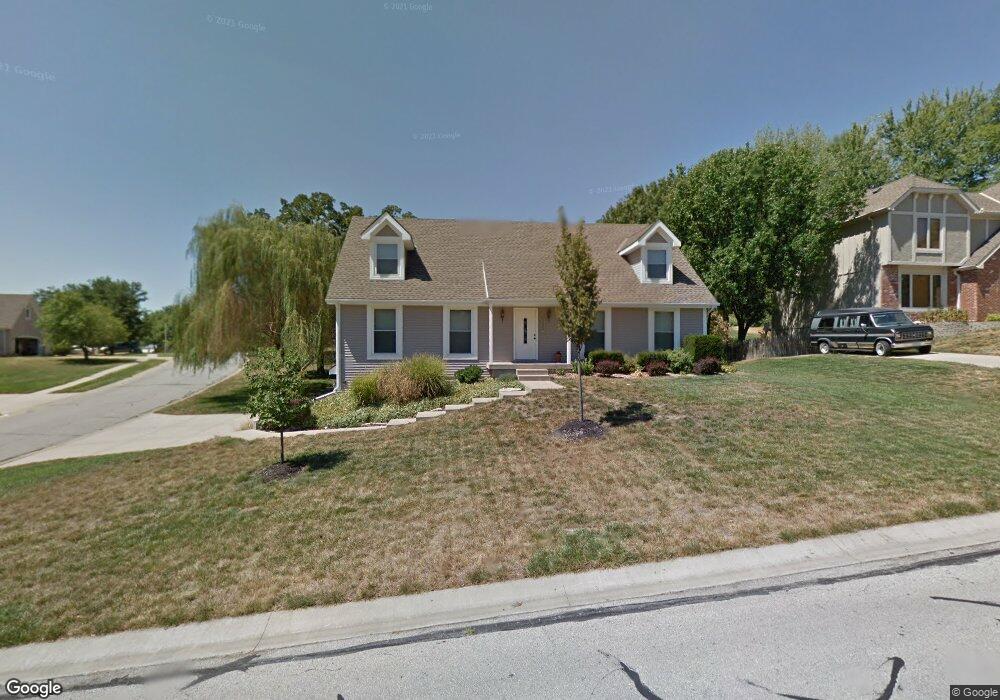
6828 Red Oak Dr Shawnee, KS 66217
Estimated Value: $423,000 - $497,000
4
Beds
3
Baths
2,456
Sq Ft
$185/Sq Ft
Est. Value
About This Home
This home is located at 6828 Red Oak Dr, Shawnee, KS 66217 and is currently estimated at $454,017, approximately $184 per square foot. 6828 Red Oak Dr is a home located in Johnson County with nearby schools including Lenexa Hills Elementary School, Trailridge Middle School, and Shawnee Mission Northwest High School.
Ownership History
Date
Name
Owned For
Owner Type
Purchase Details
Closed on
Jun 14, 2019
Sold by
Owen Christopher and Owen Jean Gale
Bought by
Yowell Ray
Current Estimated Value
Home Financials for this Owner
Home Financials are based on the most recent Mortgage that was taken out on this home.
Original Mortgage
$272,400
Outstanding Balance
$239,506
Interest Rate
4.1%
Mortgage Type
VA
Estimated Equity
$214,511
Purchase Details
Closed on
Aug 29, 2008
Sold by
Deustche Bank National Trust Co
Bought by
Owen Christopher
Home Financials for this Owner
Home Financials are based on the most recent Mortgage that was taken out on this home.
Original Mortgage
$128,000
Interest Rate
6.05%
Mortgage Type
New Conventional
Purchase Details
Closed on
Nov 27, 2007
Sold by
Jolly Weldon D and Jolly Jacquenetta
Bought by
Deutsche Bank National Trust Company
Create a Home Valuation Report for This Property
The Home Valuation Report is an in-depth analysis detailing your home's value as well as a comparison with similar homes in the area
Home Values in the Area
Average Home Value in this Area
Purchase History
| Date | Buyer | Sale Price | Title Company |
|---|---|---|---|
| Yowell Ray | -- | Thomson Affinity Title Llc | |
| Owen Christopher | -- | Mo Kan Title Services Inc | |
| Deutsche Bank National Trust Company | $201,897 | None Available |
Source: Public Records
Mortgage History
| Date | Status | Borrower | Loan Amount |
|---|---|---|---|
| Open | Yowell Ray | $272,400 | |
| Previous Owner | Owen Christopher | $128,000 |
Source: Public Records
Tax History Compared to Growth
Tax History
| Year | Tax Paid | Tax Assessment Tax Assessment Total Assessment is a certain percentage of the fair market value that is determined by local assessors to be the total taxable value of land and additions on the property. | Land | Improvement |
|---|---|---|---|---|
| 2024 | $4,066 | $38,456 | $8,242 | $30,214 |
| 2023 | $4,072 | $37,985 | $7,521 | $30,464 |
| 2022 | $3,690 | $34,305 | $7,521 | $26,784 |
| 2021 | $3,744 | $32,660 | $7,521 | $25,139 |
| 2020 | $3,624 | $31,199 | $6,834 | $24,365 |
| 2019 | $3,547 | $30,509 | $6,205 | $24,304 |
| 2018 | $3,468 | $29,716 | $6,205 | $23,511 |
| 2017 | $3,048 | $25,691 | $5,390 | $20,301 |
| 2016 | $3,036 | $25,265 | $5,390 | $19,875 |
| 2015 | $2,846 | $24,587 | $5,390 | $19,197 |
| 2013 | -- | $21,413 | $5,390 | $16,023 |
Source: Public Records
Map
Nearby Homes
- 17730 W 68th Terrace
- 17428 W 70th St
- 16128 Midland Dr
- 19403 W 64th Terrace
- 7309 Legler St
- 6005 Maurer Rd
- 6019 Maurer Rd
- 6040 Renner Rd
- 16283 W 76th Terrace
- 7621 Lichtenauer Dr
- 7229 Allman Dr
- 7239 Allman Rd
- 7237 Allman Rd
- 7231 Allman Rd
- 7221 Allman Rd
- 7219 Allman Rd
- 15832 W 61st St
- 5810 Locust St
- 5750 Locust St
- 15616 W 61st St
- 6820 Red Oak Dr
- 17802 W 69th St
- 17801 W 69th St
- 17804 W 69th St
- 17743 W 68th Terrace
- 17805 W 69th St
- 6812 Red Oak Dr
- 6825 Red Oak Dr
- 17813 W 69th St
- 17739 W 68th Terrace
- 6914 Red Oak Dr
- 17808 W 69th St
- 6913 Red Oak Dr
- 17816 W 69th St
- 17734 W 68th Terrace
- 17821 W 69th St
- 17812 W 69th St
- 6917 Red Oak Dr
- 6918 Red Oak Dr
- 6804 Red Oak Dr