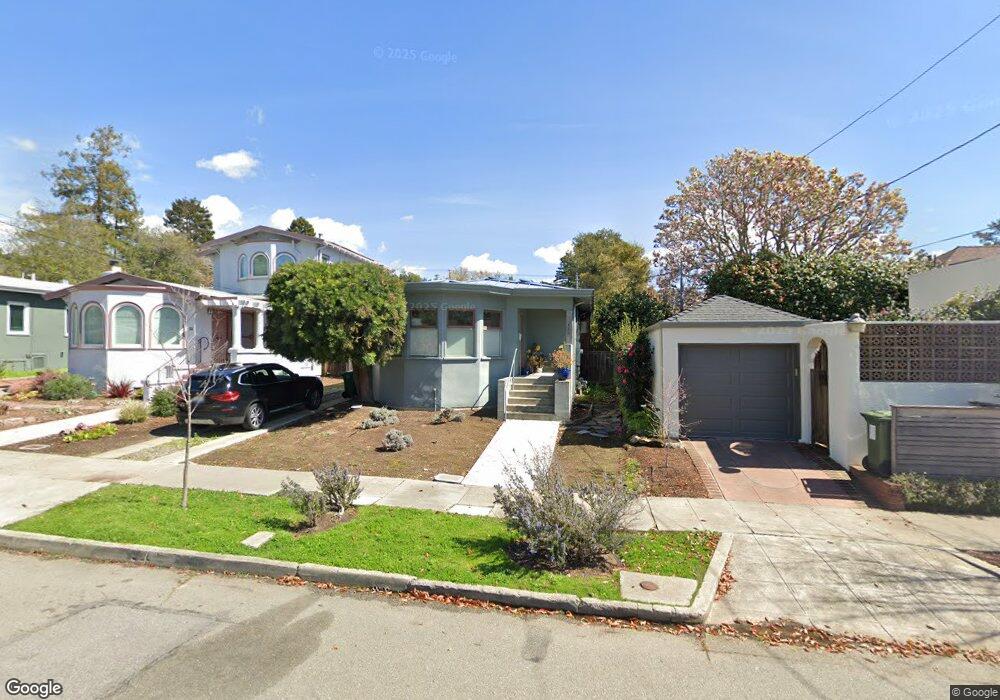
683 Neilson St Berkeley, CA 94707
Thousand Oaks NeighborhoodEstimated Value: $1,492,000 - $1,596,000
2
Beds
1
Bath
1,213
Sq Ft
$1,277/Sq Ft
Est. Value
About This Home
This home is located at 683 Neilson St, Berkeley, CA 94707 and is currently estimated at $1,549,397, approximately $1,277 per square foot. 683 Neilson St is a home located in Alameda County with nearby schools including Thousand Oaks Elementary School, Ruth Acty Elementary, and Berkeley Arts Magnet at Whittier School.
Ownership History
Date
Name
Owned For
Owner Type
Purchase Details
Closed on
Jul 20, 2016
Sold by
Wong Yuh Shich
Bought by
Ranjan Mukesh and Singh Mayuri
Current Estimated Value
Home Financials for this Owner
Home Financials are based on the most recent Mortgage that was taken out on this home.
Original Mortgage
$760,800
Outstanding Balance
$606,564
Interest Rate
3.54%
Mortgage Type
New Conventional
Estimated Equity
$942,833
Purchase Details
Closed on
Sep 26, 2013
Sold by
Kauffman Turk and Puchall Lauri
Bought by
Wong Yuh Shioh
Purchase Details
Closed on
Feb 27, 1997
Sold by
Jeffrey Joan A and Andrakin Sally J
Bought by
Kauffman Turk and Puchall Lauri
Home Financials for this Owner
Home Financials are based on the most recent Mortgage that was taken out on this home.
Original Mortgage
$179,000
Interest Rate
7.86%
Create a Home Valuation Report for This Property
The Home Valuation Report is an in-depth analysis detailing your home's value as well as a comparison with similar homes in the area
Home Values in the Area
Average Home Value in this Area
Purchase History
| Date | Buyer | Sale Price | Title Company |
|---|---|---|---|
| Ranjan Mukesh | $951,000 | Chicago Title Company | |
| Wong Yuh Shioh | $845,000 | Chicago Title Company | |
| Kauffman Turk | $249,000 | Old Republic Title Company | |
| Andrakin Sally Jane | -- | Old Republic Title Company | |
| Jeffrey Joan Anne | -- | Old Republic Title Company |
Source: Public Records
Mortgage History
| Date | Status | Borrower | Loan Amount |
|---|---|---|---|
| Open | Ranjan Mukesh | $760,800 | |
| Previous Owner | Kauffman Turk | $179,000 |
Source: Public Records
Tax History
| Year | Tax Paid | Tax Assessment Tax Assessment Total Assessment is a certain percentage of the fair market value that is determined by local assessors to be the total taxable value of land and additions on the property. | Land | Improvement |
|---|---|---|---|---|
| 2025 | $15,295 | $1,096,691 | $331,107 | $772,584 |
| 2024 | $15,295 | $1,075,057 | $324,617 | $757,440 |
| 2023 | $14,994 | $1,060,840 | $318,252 | $742,588 |
| 2022 | $14,763 | $1,033,041 | $312,012 | $728,029 |
| 2021 | $14,821 | $1,012,651 | $305,895 | $713,756 |
| 2020 | $14,124 | $1,009,200 | $302,760 | $706,440 |
| 2019 | $13,675 | $989,420 | $296,826 | $692,594 |
| 2018 | $13,469 | $970,020 | $291,006 | $679,014 |
| 2017 | $13,004 | $951,000 | $285,300 | $665,700 |
| 2016 | $11,962 | $875,021 | $262,506 | $612,515 |
| 2015 | $11,812 | $861,882 | $258,564 | $603,318 |
| 2014 | $11,770 | $845,000 | $253,500 | $591,500 |
Source: Public Records
Map
Nearby Homes
- 753 Peralta Ave
- 415 Berkeley Park Blvd
- 1858 San Lorenzo Ave
- 491 Vincente Ave
- 118 Ramona Ave
- 145 Ramona Ave
- 1266 Washington Ave
- 840 Key Route Blvd
- 712 Masonic Ave
- 1498 Sonoma Ave
- 1236 Portland Ave
- 1983 Yosemite Rd
- 417 Evelyn Ave Unit 205
- 1036 Ramona Ave
- 1741 Sonoma Ave
- 589 San Luis Rd
- 848 Stannage Ave Unit 11
- 765 San Diego Rd
- 305 Coronado St
- 483 Boynton Ave
- 677 Neilson St
- 1565 Portland Ave
- 1555 Portland Ave
- 1575 Portland Ave
- 669 Neilson St
- 680 Peralta Ave
- 1585 Portland Ave
- 670 Peralta Ave
- 661 Neilson St
- 666 Peralta Ave
- 1543 Portland Ave
- 1595 Portland Ave
- 676 Neilson St
- 660 Peralta Ave
- 657 Neilson St
- 668 Neilson St
- 1541 Portland Ave
- 652 Peralta Ave
- 701 Neilson St
- 660 Neilson St
Your Personal Tour Guide
Ask me questions while you tour the home.