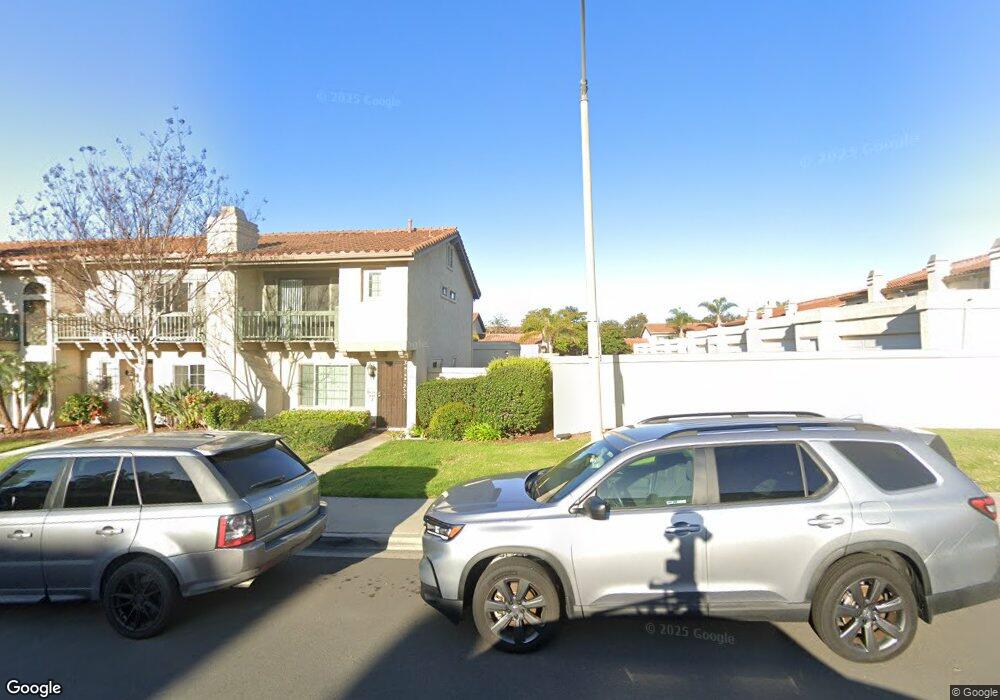
6830 Pear Tree Dr Carlsbad, CA 92011
Poinsettia NeighborhoodEstimated Value: $844,570 - $1,062,000
2
Beds
3
Baths
1,001
Sq Ft
$937/Sq Ft
Est. Value
About This Home
This home is located at 6830 Pear Tree Dr, Carlsbad, CA 92011 and is currently estimated at $937,643, approximately $936 per square foot. 6830 Pear Tree Dr is a home located in San Diego County with nearby schools including Pacific Rim Elementary, Aviara Oaks Middle, and Sage Creek High.
Ownership History
Date
Name
Owned For
Owner Type
Purchase Details
Closed on
Oct 23, 2010
Sold by
Cameron Don Thomas and Cameron Kathy Lynne
Bought by
Circle C Llc
Current Estimated Value
Purchase Details
Closed on
Dec 11, 2008
Sold by
Cameron Don Thomas and Cameron Kathy Lynne
Bought by
Cameron Don Thomas and Cameron Kathy Lynne
Purchase Details
Closed on
Aug 5, 2008
Sold by
Carlson Theresa M
Bought by
Cameron Don Thomas and Cameron Kathy Lynne
Purchase Details
Closed on
Sep 18, 2007
Sold by
Paterson Dorothy R
Bought by
Carlson Theresa M
Purchase Details
Closed on
Sep 13, 2007
Sold by
Conway John F
Bought by
Carlson Theresa M
Purchase Details
Closed on
Jan 1, 2004
Sold by
Paterson Dorothy R
Bought by
Paterson Dorothy R
Purchase Details
Closed on
Dec 16, 1994
Sold by
Williams Doris M
Bought by
Williams Doris M
Purchase Details
Closed on
Dec 1, 1986
Create a Home Valuation Report for This Property
The Home Valuation Report is an in-depth analysis detailing your home's value as well as a comparison with similar homes in the area
Home Values in the Area
Average Home Value in this Area
Purchase History
| Date | Buyer | Sale Price | Title Company |
|---|---|---|---|
| Circle C Llc | -- | None Available | |
| Cameron Don Thomas | -- | None Available | |
| Cameron Don Thomas | $405,000 | First American Title Company | |
| Carlson Theresa M | $360,500 | Fidelity National Title Co | |
| Carlson Theresa M | -- | Fidelity National Title Co | |
| Paterson Dorothy R | -- | -- | |
| Williams Doris M | -- | -- | |
| -- | $104,000 | -- |
Source: Public Records
Tax History
| Year | Tax Paid | Tax Assessment Tax Assessment Total Assessment is a certain percentage of the fair market value that is determined by local assessors to be the total taxable value of land and additions on the property. | Land | Improvement |
|---|---|---|---|---|
| 2025 | $5,501 | $521,515 | $334,801 | $186,714 |
| 2024 | $5,501 | $511,290 | $328,237 | $183,053 |
| 2023 | $5,472 | $501,265 | $321,801 | $179,464 |
| 2022 | $5,388 | $491,438 | $315,492 | $175,946 |
| 2021 | $5,348 | $481,803 | $309,306 | $172,497 |
| 2020 | $5,312 | $476,864 | $306,135 | $170,729 |
| 2019 | $5,217 | $467,515 | $300,133 | $167,382 |
| 2018 | $4,997 | $458,349 | $294,249 | $164,100 |
| 2017 | $4,915 | $449,363 | $288,480 | $160,883 |
| 2016 | $4,448 | $415,000 | $266,000 | $149,000 |
| 2015 | $4,497 | $415,000 | $266,000 | $149,000 |
| 2014 | $4,509 | $415,000 | $266,000 | $149,000 |
Source: Public Records
Map
Nearby Homes
- 907 Hickory Ct Unit 5
- 6819 Alderwood Dr
- 948 Alyssum Rd
- 6990 Batiquitos Dr Unit 1
- 857 Violet Ct
- 6871 Seaspray Ln
- 6927 Wildrose Terrace
- 7102 Linden Terrace
- 7009 Wildrose Terrace
- 7011 Wildrose Terrace
- 901 Caminito Estrada Unit C
- 908 Caminito Madrigal Unit F
- 7215 Daffodil Place
- 7137 Rockrose Terrace
- 6801 Embarcadero Ln
- 605 Seaward Ave
- 7025 San Bartolo St Unit 42
- 7243 San Luis St Unit 257
- 7218 San Lucas St Unit 189
- 7207 Santa Barbara St Unit 154
- 6832 Pear Tree Dr
- 6834 Pear Tree Dr Unit 5
- 6836 Pear Tree Dr
- 928 Hawthorne Ave
- 926 Hawthorne Ave
- 6838 Pear Tree Dr
- 924 Hawthorne Ave
- 930 Hawthorne Ave
- 932 Hawthorne Ave
- 6840 Pear Tree Dr
- 6831 Batiquitos Dr
- 6829 Batiquitos Dr
- 6833 Batiquitos Dr
- 934 Hawthorne Ave
- 6835 Batiquitos Dr
- 6829 Pear Tree Dr
- 6831 Pear Tree Dr
- 6833 Pear Tree Dr
- 6827 Pear Tree Dr
- 936 Hawthorne Ave Unit 392
Your Personal Tour Guide
Ask me questions while you tour the home.