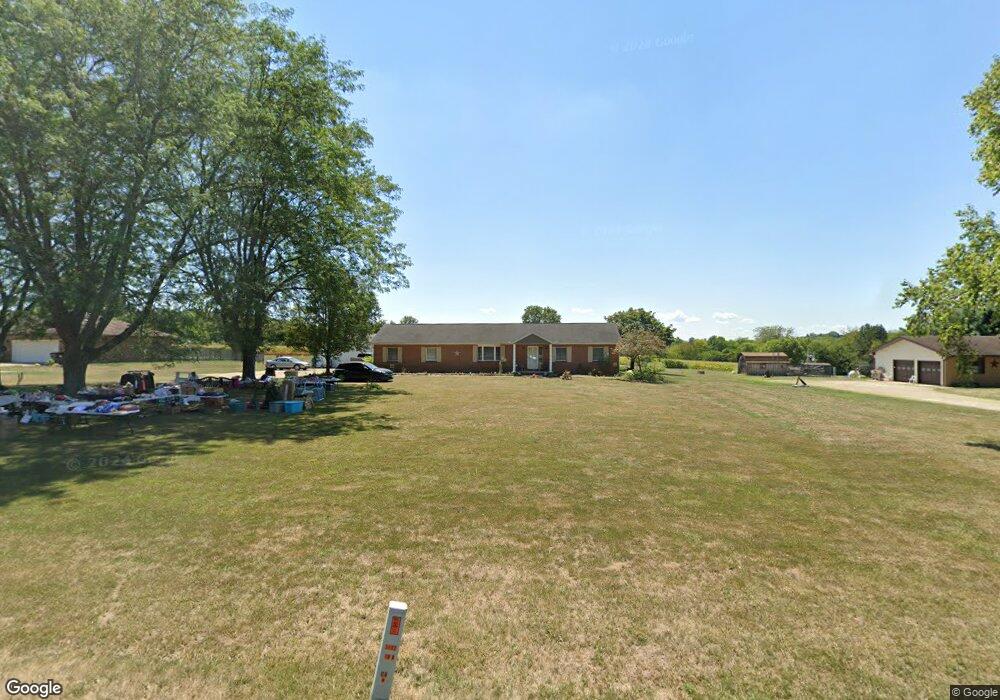
6841 Old Tarlton Pike Circleville, OH 43113
Estimated Value: $389,000 - $425,000
4
Beds
3
Baths
2,016
Sq Ft
$203/Sq Ft
Est. Value
About This Home
This home is located at 6841 Old Tarlton Pike, Circleville, OH 43113 and is currently estimated at $408,895, approximately $202 per square foot. 6841 Old Tarlton Pike is a home located in Pickaway County with nearby schools including Logan Elm High School and Crossroads Christian Academy.
Ownership History
Date
Name
Owned For
Owner Type
Purchase Details
Closed on
Jul 7, 2009
Sold by
Caudill Janalee and Caudill Todd A
Bought by
Walker Melody L and Walker Ii Gary L
Current Estimated Value
Home Financials for this Owner
Home Financials are based on the most recent Mortgage that was taken out on this home.
Original Mortgage
$181,649
Outstanding Balance
$116,306
Interest Rate
4.94%
Mortgage Type
FHA
Estimated Equity
$292,589
Purchase Details
Closed on
May 21, 1997
Sold by
Howell Marie E
Bought by
Caudill Janalee and Caudill Todd A
Home Financials for this Owner
Home Financials are based on the most recent Mortgage that was taken out on this home.
Original Mortgage
$87,000
Interest Rate
8.24%
Mortgage Type
New Conventional
Purchase Details
Closed on
Mar 12, 1991
Sold by
Howell Thadd J
Bought by
Howell Marie E
Purchase Details
Closed on
Jun 1, 1988
Purchase Details
Closed on
May 1, 1985
Create a Home Valuation Report for This Property
The Home Valuation Report is an in-depth analysis detailing your home's value as well as a comparison with similar homes in the area
Home Values in the Area
Average Home Value in this Area
Purchase History
| Date | Buyer | Sale Price | Title Company |
|---|---|---|---|
| Walker Melody L | $185,000 | Transcounty Title | |
| Caudill Janalee | $132,000 | -- | |
| Howell Marie E | -- | -- | |
| -- | $74,900 | -- | |
| -- | $24,500 | -- |
Source: Public Records
Mortgage History
| Date | Status | Borrower | Loan Amount |
|---|---|---|---|
| Open | Walker Melody L | $181,649 | |
| Closed | Caudill Janalee | $87,000 |
Source: Public Records
Tax History Compared to Growth
Tax History
| Year | Tax Paid | Tax Assessment Tax Assessment Total Assessment is a certain percentage of the fair market value that is determined by local assessors to be the total taxable value of land and additions on the property. | Land | Improvement |
|---|---|---|---|---|
| 2024 | -- | $110,960 | $17,670 | $93,290 |
| 2023 | $3,827 | $110,960 | $17,670 | $93,290 |
| 2022 | $2,950 | $80,580 | $14,620 | $65,960 |
| 2021 | $3,023 | $80,580 | $14,620 | $65,960 |
| 2020 | $3,001 | $80,580 | $14,620 | $65,960 |
| 2019 | $2,275 | $67,440 | $14,620 | $52,820 |
| 2018 | $2,685 | $67,440 | $14,620 | $52,820 |
| 2017 | $3,939 | $67,440 | $14,620 | $52,820 |
| 2016 | $1,998 | $61,560 | $14,260 | $47,300 |
| 2015 | $2,005 | $61,560 | $14,260 | $47,300 |
| 2014 | $2,008 | $61,560 | $14,260 | $47,300 |
| 2013 | $2,082 | $62,040 | $14,260 | $47,780 |
Source: Public Records
Map
Nearby Homes
- 6983 Old Tarlton Pike
- 0 Old Tarlton Pike
- 22952 Bolender Pontius Rd
- 24128 Huber Hitler Rd
- 7241 State Route 56 E
- 466 John St
- 334 Lancaster Pike
- 551 E Main St
- 208 Moats Dr
- 152 Griner Ave
- 546 E Ohio St
- 539 E Union St
- 461 Watt St
- 575 Renick Ave
- 474 Half Ave
- 5537 Tarlton Rd
- 429 Half Ave
- 231 Westwood Dr
- 418 Clinton St
- 382 E Franklin St
- 6891 Old Tarlton Pike
- 6859 Old Tarlton Pike
- 6915 Old Tarlton Pike
- 6821 Old Tarlton Pike
- 6856 Old Tarlton Pike
- 6906 Old Tarlton Pike
- 6828 Old Tarlton Pike
- 6747 Old Tarlton Pike
- 6941 Old Tarlton Pike
- 6731 Old Tarlton Pike
- 6850 Old Tarlton Pike
- 23663 Huber Hitler Rd
- 23681 Huber Hitler Rd
- 6986 Old Tarlton Pike
- 23695 Huber Hitler Rd
- 6690 Old Tarlton Pike
- 6690 Old Tarlton Pike
- 6690 Old Tarlton Pike
- 23713 Huber Hitler Rd
- 6676 Old Tarlton Pike