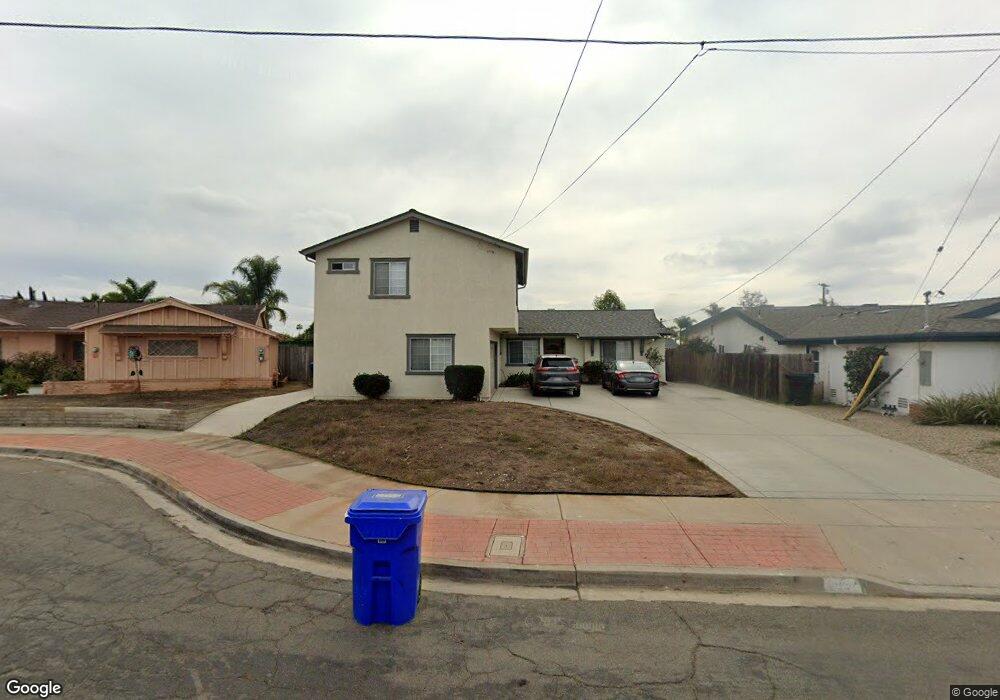
6857 Arverne Ct San Diego, CA 92111
Clairemont Mesa East NeighborhoodEstimated Value: $1,183,668 - $1,316,000
5
Beds
2
Baths
1,889
Sq Ft
$656/Sq Ft
Est. Value
About This Home
This home is located at 6857 Arverne Ct, San Diego, CA 92111 and is currently estimated at $1,239,667, approximately $656 per square foot. 6857 Arverne Ct is a home located in San Diego County with nearby schools including Clairemont Canyons Academy, Innovation Middle School, and Madison High School.
Ownership History
Date
Name
Owned For
Owner Type
Purchase Details
Closed on
Aug 15, 2016
Sold by
Shum Kam Ling and Shum Benjamin
Bought by
Shum Benjamin
Current Estimated Value
Purchase Details
Closed on
Dec 18, 2010
Sold by
Shum Kam Ling and Shum Benjamin Shek Chuen
Bought by
Shum Kam Ling and Shum Bejamin
Purchase Details
Closed on
Oct 7, 2009
Sold by
Shum Kam Ling
Bought by
Shum Kam Ling and Shum Benjamin
Home Financials for this Owner
Home Financials are based on the most recent Mortgage that was taken out on this home.
Original Mortgage
$156,550
Outstanding Balance
$101,387
Interest Rate
4.92%
Mortgage Type
New Conventional
Estimated Equity
$1,138,280
Purchase Details
Closed on
May 9, 2009
Sold by
Shum Kam Ling and Shum Benjamin Shek Chuen
Bought by
Shum Kam Ling
Purchase Details
Closed on
Nov 11, 2006
Sold by
Shum Kam Ling
Bought by
Shum Kam Ling and Kam Ling Shum Family Trust
Purchase Details
Closed on
Apr 27, 1984
Create a Home Valuation Report for This Property
The Home Valuation Report is an in-depth analysis detailing your home's value as well as a comparison with similar homes in the area
Home Values in the Area
Average Home Value in this Area
Purchase History
| Date | Buyer | Sale Price | Title Company |
|---|---|---|---|
| Shum Benjamin | -- | None Available | |
| Shum Kam Ling | -- | Lsi | |
| Shum Kam Ling | -- | Lsi | |
| Shum Kam Ling | -- | None Available | |
| Shum Kam Ling | -- | None Available | |
| -- | $106,000 | -- |
Source: Public Records
Mortgage History
| Date | Status | Borrower | Loan Amount |
|---|---|---|---|
| Open | Shum Kam Ling | $156,550 |
Source: Public Records
Tax History Compared to Growth
Tax History
| Year | Tax Paid | Tax Assessment Tax Assessment Total Assessment is a certain percentage of the fair market value that is determined by local assessors to be the total taxable value of land and additions on the property. | Land | Improvement |
|---|---|---|---|---|
| 2025 | $6,092 | $510,207 | $289,075 | $221,132 |
| 2024 | $6,092 | $500,204 | $283,407 | $216,797 |
| 2023 | $5,956 | $490,397 | $277,850 | $212,547 |
| 2022 | $5,796 | $480,782 | $272,402 | $208,380 |
| 2021 | $5,755 | $471,356 | $267,061 | $204,295 |
| 2020 | $5,684 | $466,524 | $264,323 | $202,201 |
| 2019 | $5,581 | $457,378 | $259,141 | $198,237 |
| 2018 | $5,217 | $448,410 | $254,060 | $194,350 |
| 2017 | $80 | $439,619 | $249,079 | $190,540 |
| 2016 | $3,178 | $275,121 | $95,486 | $179,635 |
| 2015 | $3,130 | $270,989 | $94,052 | $176,937 |
| 2014 | $3,080 | $265,682 | $92,210 | $173,472 |
Source: Public Records
Map
Nearby Homes
- 7003 E Batista St
- 6535 Mount Albertine Ct
- 4055 Mount Albertine Ave
- 6617 Rockglen Ave
- 3662 Marlesta Dr
- 3654 Marlesta Dr
- 7434 Salerno St
- 6333 Mount Ada Rd Unit 278
- 6333 Mount Ada Rd Unit 258
- 6333 Mount Ada Rd Unit 156
- 6333 Mount Ada Rd Unit 183
- 3906 Mount Ainsworth Ave
- 7029 Hilton Place
- 6666 Beadnell Way Unit 9
- 6666 Beadnell Way Unit 15
- 6750 Beadnell Way Unit 3
- 6602 Beadnell Way Unit 13
- 7131 Malta St
- 4261 Cannington Dr
- 3516 Atoll St
- 6839 Arverne Ct
- 6875 Arverne Ct
- 6958 Batista St
- 6976 Batista St
- 6821 Arverne Ct
- 6988 Batista St
- 6924 Batista St
- 6895 Arverne Ct
- 6856 Arverne Ct
- 6838 Arverne Ct
- 6803 Arverne Ct
- 6874 Arverne Ct
- 6998 Batista St
- 6820 Arverne Ct
- 6892 Arverne Ct
- 3914 Broadlawn St
- 6802 Arverne Ct
- 3908 Broadlawn St
- 3920 Broadlawn St
- 6877 Beloit Ave