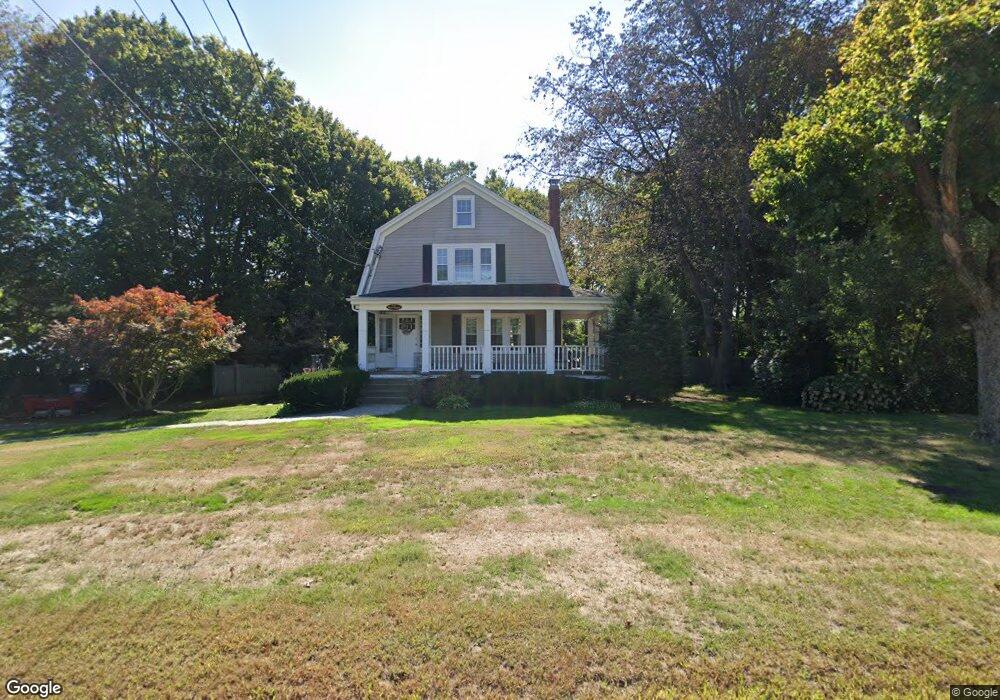
686 West St Unit single fam Braintree, MA 02184
North Braintree NeighborhoodEstimated Value: $766,000 - $793,000
2
Beds
2
Baths
1,500
Sq Ft
$521/Sq Ft
Est. Value
About This Home
This home is located at 686 West St Unit single fam, Braintree, MA 02184 and is currently estimated at $781,258, approximately $520 per square foot. 686 West St Unit single fam is a home located in Norfolk County with nearby schools including Braintree High School, Meeting House Montessori School, and Thayer Academy.
Ownership History
Date
Name
Owned For
Owner Type
Purchase Details
Closed on
Dec 17, 2012
Sold by
Blue Hill Cemetery
Bought by
686 West Street Llc
Current Estimated Value
Purchase Details
Closed on
Oct 31, 1990
Sold by
Drollett William H
Bought by
Lovell Laura A
Create a Home Valuation Report for This Property
The Home Valuation Report is an in-depth analysis detailing your home's value as well as a comparison with similar homes in the area
Home Values in the Area
Average Home Value in this Area
Purchase History
| Date | Buyer | Sale Price | Title Company |
|---|---|---|---|
| 686 West Street Llc | -- | -- | |
| Lovell Laura A | $138,000 | -- | |
| Lovell Laura A | $138,000 | -- |
Source: Public Records
Mortgage History
| Date | Status | Borrower | Loan Amount |
|---|---|---|---|
| Previous Owner | Lovell Laura A | $299,145 | |
| Previous Owner | Lovell Laura A | $97,142 | |
| Previous Owner | Lovell Laura A | $55,700 |
Source: Public Records
Tax History Compared to Growth
Tax History
| Year | Tax Paid | Tax Assessment Tax Assessment Total Assessment is a certain percentage of the fair market value that is determined by local assessors to be the total taxable value of land and additions on the property. | Land | Improvement |
|---|---|---|---|---|
| 2025 | $6,819 | $683,300 | $415,700 | $267,600 |
| 2024 | $6,155 | $649,300 | $383,800 | $265,500 |
| 2023 | $5,894 | $603,900 | $352,500 | $251,400 |
| 2022 | $5,760 | $578,900 | $327,500 | $251,400 |
| 2021 | $5,371 | $539,800 | $302,500 | $237,300 |
| 2020 | $4,978 | $504,900 | $277,500 | $227,400 |
| 2019 | $4,959 | $491,500 | $277,500 | $214,000 |
| 2018 | $4,696 | $445,500 | $240,000 | $205,500 |
| 2017 | $4,529 | $421,700 | $227,500 | $194,200 |
| 2016 | $4,269 | $388,800 | $202,500 | $186,300 |
| 2015 | $4,096 | $370,000 | $190,000 | $180,000 |
| 2014 | $3,994 | $349,700 | $182,500 | $167,200 |
Source: Public Records
Map
Nearby Homes
- 47 Addison St
- 305 Franklin St
- 7 Carter Rd
- 72 Armstrong Cir
- 80 Lake St
- 6 Oak St
- 172 Russ St
- 614 Pond St Unit 2104
- 614 Pond St Unit 1415
- 29 Joseph Rd
- 6 Franklin St
- 37 Monatiquot Ave
- 491 Washington St Unit 1
- 11 Rockefeller St
- 700 North St
- 9 Royal Crest Dr Unit 12
- 11 Royal Crest Dr Unit 5
- 26 Knights Crescent St
- 7 Scannell Rd
- 211 West St Unit 12B