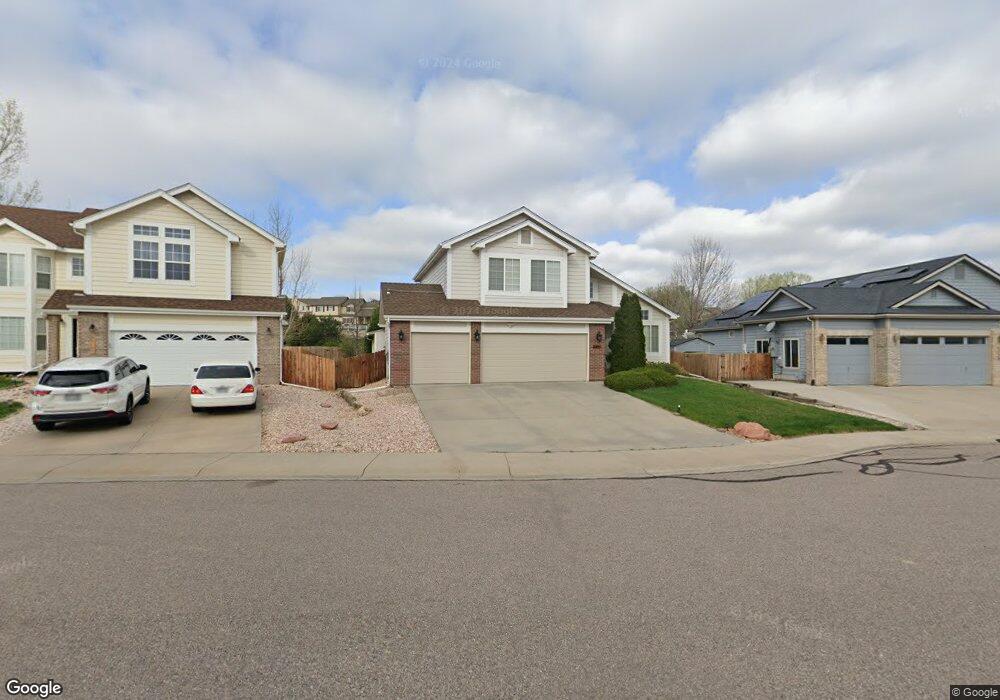
6863 Kaslam Ct Fort Collins, CO 80525
Ridgewood Hills NeighborhoodEstimated Value: $644,436 - $672,000
5
Beds
4
Baths
3,332
Sq Ft
$198/Sq Ft
Est. Value
About This Home
This home is located at 6863 Kaslam Ct, Fort Collins, CO 80525 and is currently estimated at $658,609, approximately $197 per square foot. 6863 Kaslam Ct is a home located in Larimer County with nearby schools including Coyote Ridge Elementary School, Lucile Erwin Middle School, and Loveland High School.
Ownership History
Date
Name
Owned For
Owner Type
Purchase Details
Closed on
Dec 15, 2011
Sold by
Page Matthew L and Page Jenny D
Bought by
Armstrong Anthony J
Current Estimated Value
Home Financials for this Owner
Home Financials are based on the most recent Mortgage that was taken out on this home.
Original Mortgage
$304,407
Outstanding Balance
$208,435
Interest Rate
4.03%
Mortgage Type
VA
Estimated Equity
$450,174
Purchase Details
Closed on
Jun 19, 2001
Sold by
Page Matthew L
Bought by
Page Matthew L and Page Jenny D
Home Financials for this Owner
Home Financials are based on the most recent Mortgage that was taken out on this home.
Original Mortgage
$187,000
Interest Rate
7.07%
Mortgage Type
Purchase Money Mortgage
Purchase Details
Closed on
Feb 29, 2000
Sold by
Us Home Corporation
Bought by
Page Matthew L
Home Financials for this Owner
Home Financials are based on the most recent Mortgage that was taken out on this home.
Original Mortgage
$179,350
Interest Rate
8.31%
Create a Home Valuation Report for This Property
The Home Valuation Report is an in-depth analysis detailing your home's value as well as a comparison with similar homes in the area
Home Values in the Area
Average Home Value in this Area
Purchase History
| Date | Buyer | Sale Price | Title Company |
|---|---|---|---|
| Armstrong Anthony J | $301,100 | Unified Title Company Of Nor | |
| Page Matthew L | -- | -- | |
| Page Matthew L | $234,240 | Stewart Title |
Source: Public Records
Mortgage History
| Date | Status | Borrower | Loan Amount |
|---|---|---|---|
| Open | Armstrong Anthony J | $304,407 | |
| Previous Owner | Page Matthew L | $187,000 | |
| Previous Owner | Page Matthew L | $179,350 |
Source: Public Records
Tax History Compared to Growth
Tax History
| Year | Tax Paid | Tax Assessment Tax Assessment Total Assessment is a certain percentage of the fair market value that is determined by local assessors to be the total taxable value of land and additions on the property. | Land | Improvement |
|---|---|---|---|---|
| 2025 | $3,583 | $45,728 | $3,015 | $42,713 |
| 2024 | $3,466 | $45,728 | $3,015 | $42,713 |
| 2022 | $2,956 | $34,723 | $3,128 | $31,595 |
| 2021 | $3,041 | $35,722 | $3,218 | $32,504 |
| 2020 | $2,923 | $34,328 | $3,218 | $31,110 |
| 2019 | $2,876 | $34,328 | $3,218 | $31,110 |
| 2018 | $2,560 | $29,117 | $3,240 | $25,877 |
| 2017 | $2,228 | $29,117 | $3,240 | $25,877 |
| 2016 | $2,255 | $28,537 | $3,582 | $24,955 |
| 2015 | $2,237 | $28,530 | $3,580 | $24,950 |
| 2014 | $1,975 | $24,430 | $3,580 | $20,850 |
Source: Public Records
Map
Nearby Homes
- 208 Egyptian Ct
- 7008 Woodrow Dr
- 6815 S College Ave
- 225 W Trilby Rd
- 6612 Avondale Rd Unit 2B
- 530 Holyoke Ct
- 506 Yuma Ct
- 217 W Trilby Rd
- 120 Triangle Dr
- 301 Uranus St
- 626 Prichett Ct
- 216 Gary Dr
- 602 Peyton Dr
- 7368 New Raymer Ct
- 505 Coyote Trail Dr
- 6908 Autumn Ridge Dr
- 708 Crown Ridge Ln
- 410 Ruby Dr
- 5942 Colby St
- 6603 Autumn Ridge Dr Unit 2
- 6857 Kaslam Ct
- 6869 Kaslam Ct
- 6909 Egyptian Dr
- 6851 Kaslam Ct
- 6862 Kaslam Ct
- 6915 Egyptian Dr
- 6856 Kaslam Ct
- 6902 Egyptian Dr
- 6921 Egyptian Dr
- 227 Egyptian Ct
- 220 Egyptian Ct
- 221 Egyptian Ct
- 403 Hudson Ct
- 6908 Egyptian Dr
- 320 Strasburg Dr Unit A7
- 320 Strasburg Dr Unit 185
- 320 Strasburg Dr Unit 184
- 320 Strasburg Dr Unit 183
- 320 Strasburg Dr Unit 182
- 320 Strasburg Dr Unit 181