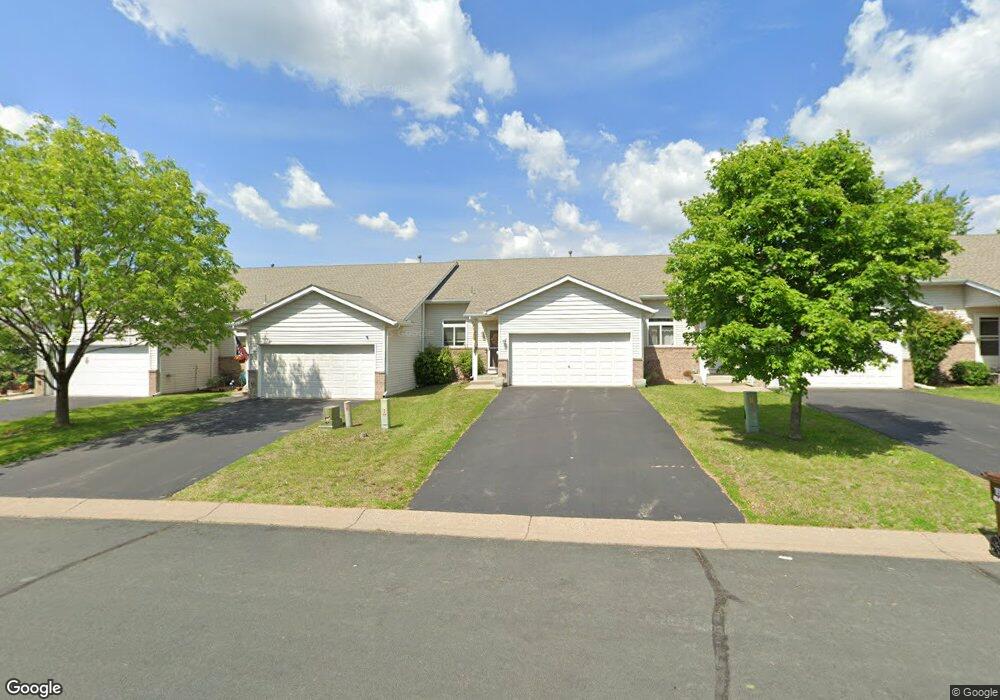
688 35th St W Hastings, MN 55033
Hastings-Marshan Township NeighborhoodEstimated Value: $275,000 - $278,331
3
Beds
2
Baths
1,740
Sq Ft
$159/Sq Ft
Est. Value
About This Home
This home is located at 688 35th St W, Hastings, MN 55033 and is currently estimated at $277,083, approximately $159 per square foot. 688 35th St W is a home located in Dakota County with nearby schools including Pinecrest Elementary School, Hastings Middle School, and Hastings High School.
Ownership History
Date
Name
Owned For
Owner Type
Purchase Details
Closed on
Feb 18, 2022
Sold by
Shatek Michael D and Shatek Patricia
Bought by
Gilbert Alyssa
Current Estimated Value
Purchase Details
Closed on
May 18, 2018
Sold by
Dahiman Christopher and Dahiman Cathy
Bought by
Shatek Matthew D
Home Financials for this Owner
Home Financials are based on the most recent Mortgage that was taken out on this home.
Original Mortgage
$176,739
Interest Rate
4.62%
Mortgage Type
FHA
Purchase Details
Closed on
Oct 10, 2007
Sold by
Sieben Patrick C and Sieben Rebecca L
Bought by
Dahlman Christopher
Home Financials for this Owner
Home Financials are based on the most recent Mortgage that was taken out on this home.
Original Mortgage
$153,225
Interest Rate
6.44%
Mortgage Type
VA
Purchase Details
Closed on
Jul 31, 2003
Sold by
Mw Johnson Construction
Bought by
Sieben Rebecca L and Sieben Patrick C
Purchase Details
Closed on
Mar 28, 2003
Sold by
Jablonske Gregory A and Jablonske Susan M
Bought by
M W Johnson Construction Inc
Create a Home Valuation Report for This Property
The Home Valuation Report is an in-depth analysis detailing your home's value as well as a comparison with similar homes in the area
Home Values in the Area
Average Home Value in this Area
Purchase History
| Date | Buyer | Sale Price | Title Company |
|---|---|---|---|
| Gilbert Alyssa | $250,000 | -- | |
| Shatek Matthew D | $180,000 | Dca Title | |
| Dahlman Christopher | $156,000 | -- | |
| Sieben Rebecca L | $155,664 | -- | |
| M W Johnson Construction Inc | $300,000 | -- |
Source: Public Records
Mortgage History
| Date | Status | Borrower | Loan Amount |
|---|---|---|---|
| Previous Owner | Shatek Matthew D | $176,739 | |
| Previous Owner | Dahlman Christopher | $153,225 |
Source: Public Records
Tax History Compared to Growth
Tax History
| Year | Tax Paid | Tax Assessment Tax Assessment Total Assessment is a certain percentage of the fair market value that is determined by local assessors to be the total taxable value of land and additions on the property. | Land | Improvement |
|---|---|---|---|---|
| 2024 | $2,728 | $254,900 | $40,200 | $214,700 |
| 2023 | $2,741 | $248,400 | $40,000 | $208,400 |
| 2022 | $2,592 | $248,500 | $39,900 | $208,600 |
| 2021 | $2,396 | $210,500 | $34,700 | $175,800 |
| 2020 | $2,376 | $193,200 | $33,000 | $160,200 |
| 2019 | $2,113 | $185,200 | $31,500 | $153,700 |
| 2018 | $2,021 | $173,600 | $30,000 | $143,600 |
| 2017 | $1,893 | $162,500 | $28,500 | $134,000 |
| 2016 | $1,691 | $153,800 | $26,700 | $127,100 |
| 2015 | $1,466 | $112,635 | $21,053 | $91,582 |
| 2014 | -- | $97,484 | $19,323 | $78,161 |
| 2013 | -- | $79,281 | $16,019 | $63,262 |
Source: Public Records
Map
Nearby Homes
- 365 Hayes Dr Unit 30
- 753 Greten Ln
- 782 31st St W
- 379 Frederick Cir Unit 905
- 313 Frederick Cir Unit 106
- 3525 Vermillion St
- 3575 Vermillion St
- 1163 Teal Way
- 3125 Village Trail Unit 217
- 2000 Forest St
- 3591 Village Way
- 1942 Eddy St
- 2021 Pine St
- 235 Tiffany Dr
- 3525 Douglas Dr
- 416 19th St W
- 182 Sandpiper Cir
- 3200 Malcolm Ave
- 1815 Louis Ln
- 528 17th St E