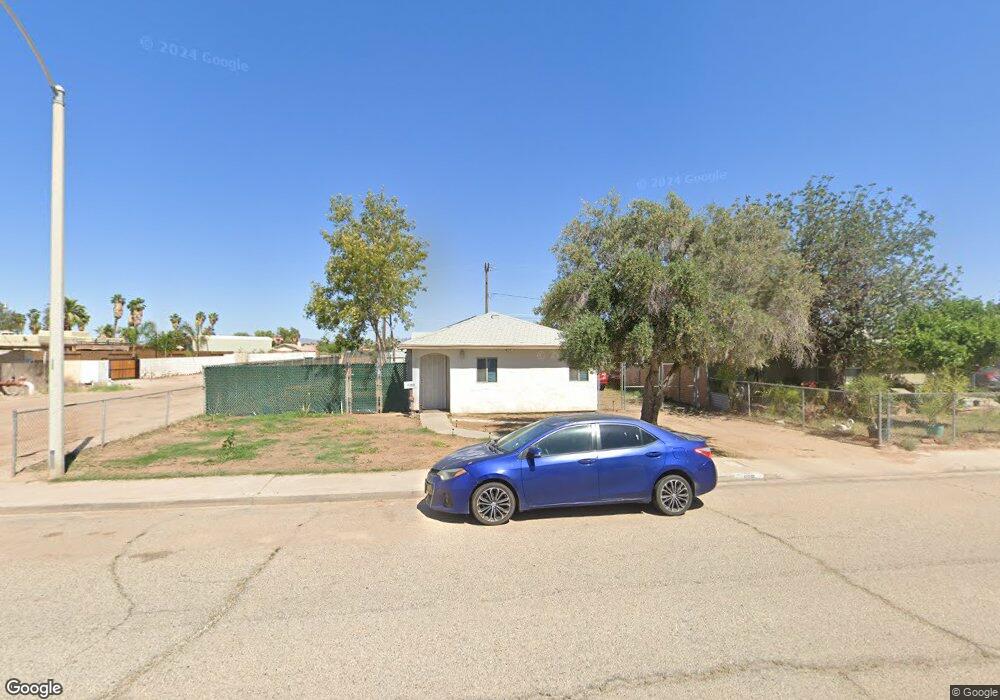
688 N Eucapyptus Ave Blythe, CA 92225
Estimated Value: $157,000 - $214,498
3
Beds
2
Baths
1,128
Sq Ft
$173/Sq Ft
Est. Value
About This Home
This home is located at 688 N Eucapyptus Ave, Blythe, CA 92225 and is currently estimated at $195,125, approximately $172 per square foot. 688 N Eucapyptus Ave is a home located in Riverside County with nearby schools including Palo Verde High School and Scale Leadership Academy - East.
Ownership History
Date
Name
Owned For
Owner Type
Purchase Details
Closed on
Oct 13, 2023
Sold by
Family Trust
Bought by
Garcia Mia Guillermina and Salto Teodoro Gallegos
Current Estimated Value
Home Financials for this Owner
Home Financials are based on the most recent Mortgage that was taken out on this home.
Original Mortgage
$181,649
Outstanding Balance
$178,117
Interest Rate
7.18%
Mortgage Type
FHA
Estimated Equity
$17,008
Purchase Details
Closed on
Nov 28, 2018
Sold by
Royer William and Wiro Royer Joan
Bought by
Osborne John D and Osborne Sharon
Purchase Details
Closed on
Jun 16, 1994
Sold by
Means Robert L and Means Mary L
Bought by
Royer William and Wiro Royer Joan
Home Financials for this Owner
Home Financials are based on the most recent Mortgage that was taken out on this home.
Original Mortgage
$64,574
Interest Rate
8.83%
Create a Home Valuation Report for This Property
The Home Valuation Report is an in-depth analysis detailing your home's value as well as a comparison with similar homes in the area
Home Values in the Area
Average Home Value in this Area
Purchase History
| Date | Buyer | Sale Price | Title Company |
|---|---|---|---|
| Garcia Mia Guillermina | $185,000 | First American Title | |
| Osborne John D | $81,500 | Stewart Title Of California | |
| Royer William | $70,000 | Chicago Title Company |
Source: Public Records
Mortgage History
| Date | Status | Borrower | Loan Amount |
|---|---|---|---|
| Open | Garcia Mia Guillermina | $181,649 | |
| Previous Owner | Royer William | $64,574 |
Source: Public Records
Tax History
| Year | Tax Paid | Tax Assessment Tax Assessment Total Assessment is a certain percentage of the fair market value that is determined by local assessors to be the total taxable value of land and additions on the property. | Land | Improvement |
|---|---|---|---|---|
| 2025 | $2,039 | $185,639 | $53,035 | $132,604 |
| 2023 | $2,039 | $86,040 | $24,580 | $61,460 |
| 2022 | $955 | $84,354 | $24,099 | $60,255 |
| 2021 | $931 | $82,701 | $23,627 | $59,074 |
| 2020 | $921 | $81,854 | $23,385 | $58,469 |
| 2019 | $913 | $80,250 | $22,927 | $57,323 |
| 2018 | $1,129 | $104,533 | $29,860 | $74,673 |
| 2017 | $1,106 | $102,484 | $29,275 | $73,209 |
| 2016 | $1,095 | $100,475 | $28,701 | $71,774 |
| 2015 | $1,085 | $98,968 | $28,271 | $70,697 |
| 2014 | $1,044 | $97,031 | $27,718 | $69,313 |
Source: Public Records
Map
Nearby Homes
- 521 W Oregon St
- 560 Parker Place
- 0 W Lane c
- 570 Holley Ln
- 821 Cypress Ln
- 518 N Eucalyptus Ave
- 251 W Juniper Trail
- 9481 N Broadway
- 161 Eunice Cir
- 470 N Willow St
- 158 Eunice Cir
- 441 N Willow St
- 410 N Lovekin Blvd
- 266 Shannon St
- 1053 Catalina Dr
- 1007 N Broadway
- 1030 N Lovekin Blvd Unit 27
- 340 N Lovekin Blvd
- 0 Blythe Unit 219122850DA
- 0 Blythe Unit 219122849DA
- 688 N Eucalyptus Ave
- 678 N Eucalyptus Ave
- 668 N Eucalyptus Ave
- 715 N Eucalyptus Ave
- 652 N Eucalyptus Ave
- 480 Glider Ct
- 652 N Eucalyptus Ave
- 490 Glider Ct
- 689 N Eucalyptus Ave
- 470 Glider Ct
- 636 N Eucalyptus Ave
- 653 N Eucalyptus Ave
- 460 Glider Ct
- 637 N Eucalyptus Ave
- 634 N Eucalyptus Ave
- 0 W Oregon St Unit 21381251
- 0 W Oregon St Unit 219034589DA
- 0 W Oregon St Unit 219012965DA
- 0 W Oregon St
- 742 N Eucalyptus Ave
Your Personal Tour Guide
Ask me questions while you tour the home.