Estimated Value: $387,000 - $509,012
3
Beds
3
Baths
2,441
Sq Ft
$177/Sq Ft
Est. Value
About This Home
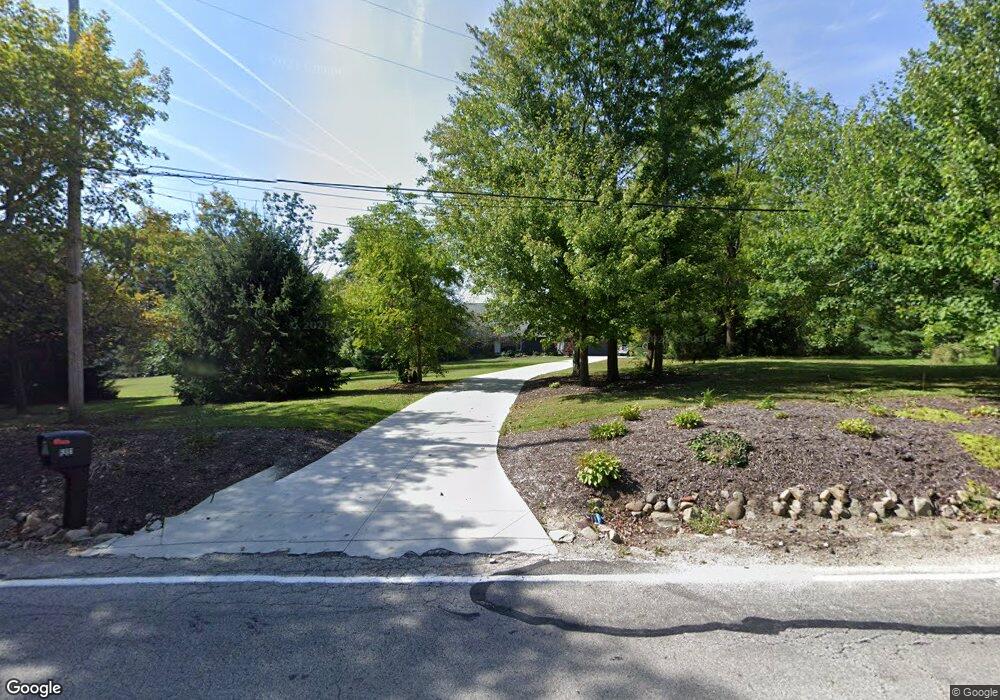
This home is located at 6881 Hudson Rd, Kent, OH 44240 and is currently estimated at $432,003, approximately $176 per square foot. 6881 Hudson Rd is a home located in Portage County with nearby schools including Davey Elementary School, Stanton Middle School, and Theodore Roosevelt High School.
Ownership History
Date
Name
Owned For
Owner Type
Purchase Details
Closed on
Feb 1, 2016
Sold by
Snellenberger Ii Samuel R and Snellenberger Shelby R
Bought by
Snellenberger Ii Samuel R and Snellenberger Shelby R
Current Estimated Value
Purchase Details
Closed on
Jun 30, 2008
Sold by
Snellenberger Samuel R and Snellenberger Shelby R
Bought by
Snellenberger Ii Samuel R and Snellenberger Shelby R
Purchase Details
Closed on
May 16, 2008
Sold by
Sly Family Lp
Bought by
Snellenberger Ii Samuel R and Snellenbergel Shelby R
Purchase Details
Closed on
Feb 15, 2002
Sold by
Oates Ralph L
Bought by
Snellenberger Ii Samuel R
Home Financials for this Owner
Home Financials are based on the most recent Mortgage that was taken out on this home.
Original Mortgage
$168,000
Interest Rate
7.23%
Purchase Details
Closed on
May 1, 1990
Bought by
Oates Ralph L
Create a Home Valuation Report for This Property
The Home Valuation Report is an in-depth analysis detailing your home's value as well as a comparison with similar homes in the area
Home Values in the Area
Average Home Value in this Area
Purchase History
| Date | Buyer | Sale Price | Title Company |
|---|---|---|---|
| Snellenberger Ii Samuel R | -- | Dimond Title Co | |
| Snellenberger Ii Samuel R | -- | Attorney | |
| Snellenberger Ii Samuel R | -- | Attorney | |
| Snellenberger Ii Samuel R | $210,000 | Title Professionals Inc | |
| Oates Ralph L | -- | -- |
Source: Public Records
Mortgage History
| Date | Status | Borrower | Loan Amount |
|---|---|---|---|
| Previous Owner | Snellenberger Ii Samuel R | $168,000 | |
| Closed | Snellenberger Ii Samuel R | $31,500 |
Source: Public Records
Tax History Compared to Growth
Tax History
| Year | Tax Paid | Tax Assessment Tax Assessment Total Assessment is a certain percentage of the fair market value that is determined by local assessors to be the total taxable value of land and additions on the property. | Land | Improvement |
|---|---|---|---|---|
| 2024 | $6,734 | $145,040 | $23,520 | $121,520 |
| 2023 | $6,310 | $109,380 | $23,520 | $85,860 |
| 2022 | $6,301 | $109,380 | $23,520 | $85,860 |
| 2021 | $6,297 | $109,380 | $23,520 | $85,860 |
| 2020 | $6,371 | $98,840 | $23,520 | $75,320 |
| 2019 | $6,328 | $98,840 | $23,520 | $75,320 |
| 2018 | $5,539 | $82,670 | $23,520 | $59,150 |
| 2017 | $5,539 | $82,670 | $23,520 | $59,150 |
| 2016 | $5,503 | $82,670 | $23,520 | $59,150 |
| 2015 | $5,482 | $82,670 | $23,520 | $59,150 |
| 2014 | $5,426 | $80,400 | $23,520 | $56,880 |
| 2013 | $5,386 | $80,400 | $23,520 | $56,880 |
Source: Public Records
Map
Nearby Homes
- 1037 Verona Dr
- 1046 Hudson Rd
- 940 Kevin Dr
- 474 W Grant St
- 409 W Grant St
- 7263 State Route 43
- 4451 Newcomer Rd
- 7447 Sylvan Dr
- 529 Rockwell St
- 3165 Peterboro Dr
- 510 Earl Ave
- 978 Silver Meadows Blvd
- 7693 Ferguson Rd
- 329 N Willow St
- 115 S Mantua St
- 600 Silver Meadows Blvd
- 1103 Oakwood Dr
- 7723 W Lake Blvd
- 1367 Mockingbird Dr
- 5241 Brockton Dr