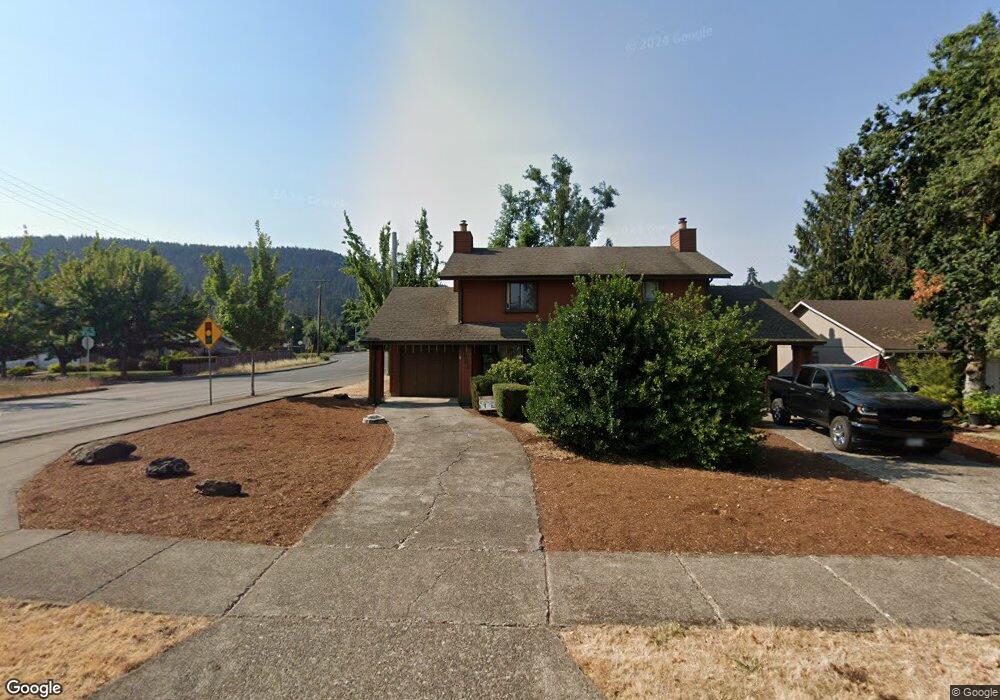
6891 B St Springfield, OR 97478
Thurston NeighborhoodEstimated Value: $479,000 - $515,000
4
Beds
2
Baths
1,937
Sq Ft
$255/Sq Ft
Est. Value
About This Home
This home is located at 6891 B St, Springfield, OR 97478 and is currently estimated at $493,796, approximately $254 per square foot. 6891 B St is a home located in Lane County with nearby schools including Ridgeview Elementary School, Thurston Middle School, and Thurston High School.
Ownership History
Date
Name
Owned For
Owner Type
Purchase Details
Closed on
Dec 14, 2020
Sold by
Rodriguez Lorena and Serrano Mary
Bought by
Vostry Samantha M and Vostry Evan M
Current Estimated Value
Home Financials for this Owner
Home Financials are based on the most recent Mortgage that was taken out on this home.
Original Mortgage
$334,332
Outstanding Balance
$296,969
Interest Rate
2.7%
Mortgage Type
FHA
Estimated Equity
$196,827
Purchase Details
Closed on
Jun 14, 2018
Sold by
Gammie Mary E and Estate Of Donald E Watts Sr
Bought by
Gammie Douglas L and Gammie Mary E
Home Financials for this Owner
Home Financials are based on the most recent Mortgage that was taken out on this home.
Original Mortgage
$169,133
Interest Rate
4.5%
Mortgage Type
New Conventional
Create a Home Valuation Report for This Property
The Home Valuation Report is an in-depth analysis detailing your home's value as well as a comparison with similar homes in the area
Home Values in the Area
Average Home Value in this Area
Purchase History
| Date | Buyer | Sale Price | Title Company |
|---|---|---|---|
| Vostry Samantha M | $340,500 | Fidelity Natl Ttl Co Of Or | |
| Gammie Douglas L | $225,510 | Evergreen Land Title Co |
Source: Public Records
Mortgage History
| Date | Status | Borrower | Loan Amount |
|---|---|---|---|
| Open | Vostry Samantha M | $334,332 | |
| Previous Owner | Gammie Douglas L | $169,133 |
Source: Public Records
Tax History Compared to Growth
Tax History
| Year | Tax Paid | Tax Assessment Tax Assessment Total Assessment is a certain percentage of the fair market value that is determined by local assessors to be the total taxable value of land and additions on the property. | Land | Improvement |
|---|---|---|---|---|
| 2025 | $4,364 | $237,990 | -- | -- |
| 2024 | $4,293 | $231,059 | -- | -- |
| 2023 | $4,293 | $224,330 | -- | -- |
| 2022 | $3,976 | $217,797 | $0 | $0 |
| 2021 | $3,905 | $211,454 | $0 | $0 |
| 2020 | $3,791 | $205,296 | $0 | $0 |
| 2019 | $3,677 | $199,317 | $0 | $0 |
| 2018 | $3,466 | $187,876 | $0 | $0 |
| 2017 | $3,333 | $187,876 | $0 | $0 |
| 2016 | $3,263 | $182,404 | $0 | $0 |
| 2015 | $3,170 | $177,091 | $0 | $0 |
| 2014 | $3,122 | $171,933 | $0 | $0 |
Source: Public Records
Map
Nearby Homes
- 6887 B St
- 250 68th St
- 6981 Main St
- 353 71st St
- 0 71st St
- 296 S 68th Ct
- 6964 Bluebelle Way
- 353 72nd St
- 0 S 67th St Unit 693960327
- 0 Omlid Dr Unit 1 706471345
- 0 Omlid Dr Unit 27 796722689
- 0 Omlid Dr Unit 26 256458253
- 0 Omlid Dr Unit 3 154724851
- 0 Omlid Dr Unit 2 312357104
- 595 S 68th Place
- 0 S 69th Place
- 6808 Moses Pass
- 7080 Thurston Rd Unit 2
- 7048 Glacier Dr
- 7025 Glacier Dr