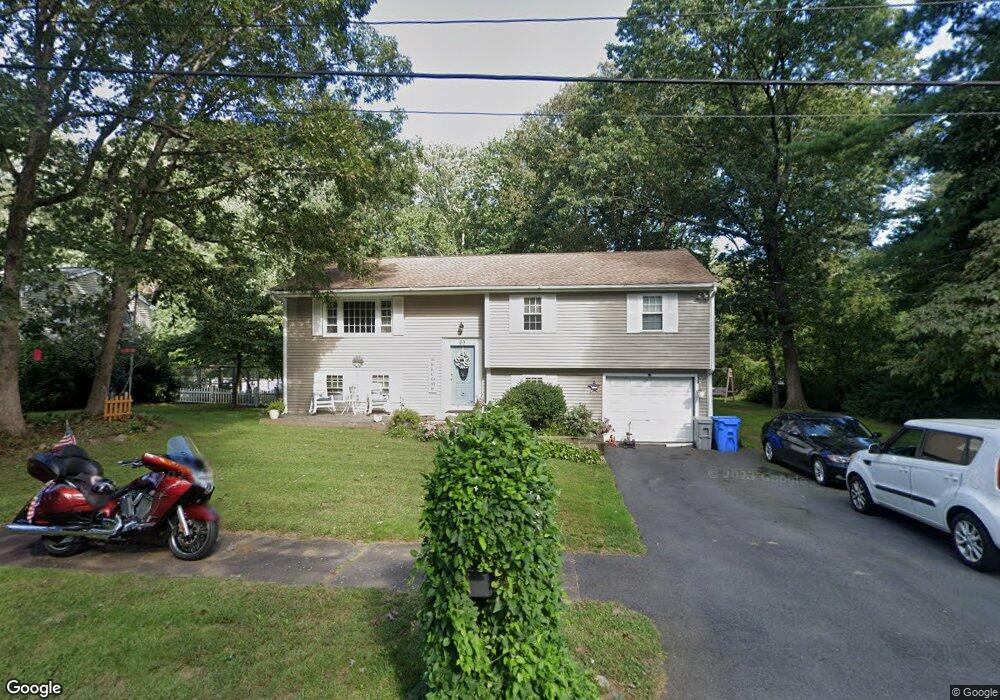
69 Alden Rd Holliston, MA 01746
Estimated Value: $638,801 - $687,000
3
Beds
3
Baths
1,737
Sq Ft
$384/Sq Ft
Est. Value
About This Home
This home is located at 69 Alden Rd, Holliston, MA 01746 and is currently estimated at $666,450, approximately $383 per square foot. 69 Alden Rd is a home located in Middlesex County with nearby schools including Miller Elementary School, Robert H. Adams Middle School, and Holliston High School.
Ownership History
Date
Name
Owned For
Owner Type
Purchase Details
Closed on
Oct 1, 2018
Sold by
Garnhum John L and Garnhum Verna E
Bought by
Garnhum Kelli and Garnhum Marc T
Current Estimated Value
Home Financials for this Owner
Home Financials are based on the most recent Mortgage that was taken out on this home.
Original Mortgage
$224,000
Outstanding Balance
$195,341
Interest Rate
4.5%
Mortgage Type
New Conventional
Estimated Equity
$471,109
Purchase Details
Closed on
Sep 15, 2000
Sold by
Smith Christopher S and Smith Karen
Bought by
Garnhum John L and Garnhum Verna E
Home Financials for this Owner
Home Financials are based on the most recent Mortgage that was taken out on this home.
Original Mortgage
$201,600
Interest Rate
8.07%
Mortgage Type
Purchase Money Mortgage
Purchase Details
Closed on
Dec 16, 1988
Sold by
Varney Alice R
Bought by
Smith Christopher S
Create a Home Valuation Report for This Property
The Home Valuation Report is an in-depth analysis detailing your home's value as well as a comparison with similar homes in the area
Home Values in the Area
Average Home Value in this Area
Purchase History
| Date | Buyer | Sale Price | Title Company |
|---|---|---|---|
| Garnhum Kelli | -- | -- | |
| Garnhum John L | $252,000 | -- | |
| Smith Christopher S | $189,000 | -- |
Source: Public Records
Mortgage History
| Date | Status | Borrower | Loan Amount |
|---|---|---|---|
| Open | Garnhum Kelli | $224,000 | |
| Previous Owner | Smith Christopher S | $30,000 | |
| Previous Owner | Smith Christopher S | $201,600 | |
| Previous Owner | Smith Christopher S | $166,400 |
Source: Public Records
Tax History Compared to Growth
Tax History
| Year | Tax Paid | Tax Assessment Tax Assessment Total Assessment is a certain percentage of the fair market value that is determined by local assessors to be the total taxable value of land and additions on the property. | Land | Improvement |
|---|---|---|---|---|
| 2025 | $8,518 | $581,400 | $243,300 | $338,100 |
| 2024 | $7,678 | $509,800 | $243,300 | $266,500 |
| 2023 | $7,395 | $480,200 | $243,300 | $236,900 |
| 2022 | $6,978 | $401,500 | $243,300 | $158,200 |
| 2021 | $6,965 | $390,200 | $232,000 | $158,200 |
| 2020 | $6,822 | $361,900 | $209,100 | $152,800 |
| 2019 | $6,668 | $354,100 | $203,000 | $151,100 |
| 2018 | $6,611 | $354,100 | $203,000 | $151,100 |
| 2017 | $6,573 | $354,900 | $207,200 | $147,700 |
| 2016 | $6,118 | $325,600 | $177,900 | $147,700 |
| 2015 | $5,789 | $298,700 | $143,900 | $154,800 |
Source: Public Records
Map
Nearby Homes
- 140 Goulding St
- 266 Willowgate Rise
- 1 Jameson Dr Unit 1
- 3 Jameson Dr Unit 3
- 625 Norfolk St
- 27 Richardson Dr Unit 27
- 73 Orchard St
- 18 Lansing Way Unit 18
- 20 Lansing Way Unit 20
- 6 Glen Ellen Blvd Unit 6
- 0 Hill St
- 156 Mitchell Rd
- 30 Broken Tree Rd
- 7 Hill St
- 30 Powderhorn Ln
- 1 Walnut Ln
- 50 Walnut St
- 121 Bullard St
- 9 Bogastow Cir
- 19 Sycamore Way Unit L40