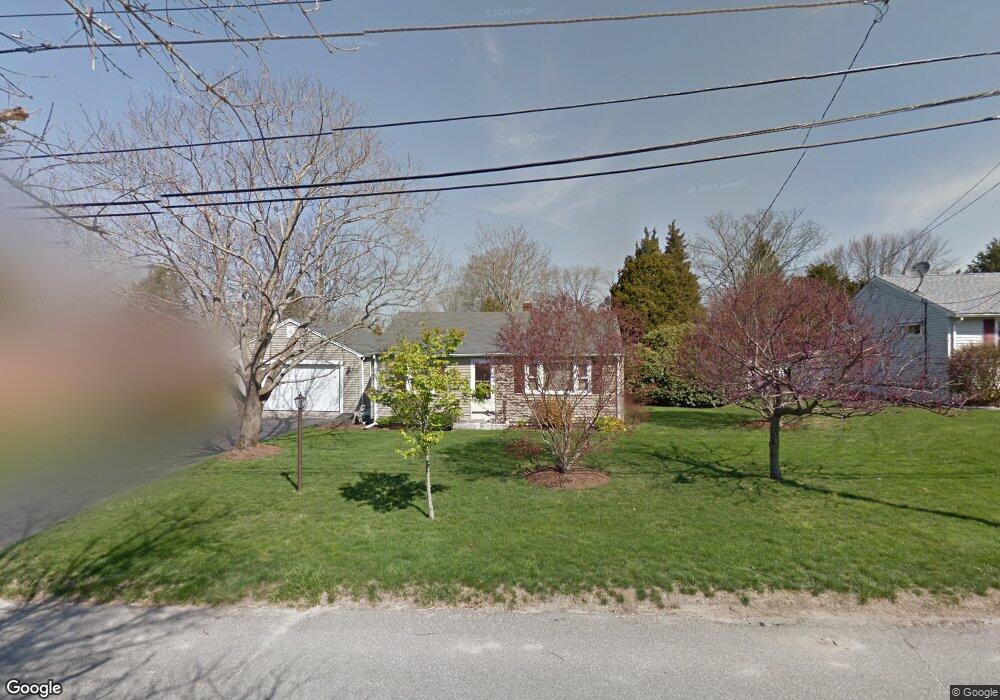
69 Beach Rd Bristol, RI 02809
Bristol Highlands NeighborhoodEstimated Value: $435,668 - $502,000
1
Bed
1
Bath
825
Sq Ft
$574/Sq Ft
Est. Value
About This Home
This home is located at 69 Beach Rd, Bristol, RI 02809 and is currently estimated at $473,917, approximately $574 per square foot. 69 Beach Rd is a home located in Bristol County with nearby schools including Mt. Hope High School, Highlander Charter Middle and High School, and Our Lady of Mt. Carmel School.
Ownership History
Date
Name
Owned For
Owner Type
Purchase Details
Closed on
Apr 21, 2021
Sold by
Mclaughlin David G Est
Bought by
Soban Jacek and Soban Monika M
Current Estimated Value
Home Financials for this Owner
Home Financials are based on the most recent Mortgage that was taken out on this home.
Original Mortgage
$292,500
Outstanding Balance
$264,303
Interest Rate
3.05%
Mortgage Type
Purchase Money Mortgage
Estimated Equity
$209,614
Create a Home Valuation Report for This Property
The Home Valuation Report is an in-depth analysis detailing your home's value as well as a comparison with similar homes in the area
Home Values in the Area
Average Home Value in this Area
Purchase History
| Date | Buyer | Sale Price | Title Company |
|---|---|---|---|
| Soban Jacek | $325,000 | None Available |
Source: Public Records
Mortgage History
| Date | Status | Borrower | Loan Amount |
|---|---|---|---|
| Open | Soban Jacek | $292,500 |
Source: Public Records
Tax History Compared to Growth
Tax History
| Year | Tax Paid | Tax Assessment Tax Assessment Total Assessment is a certain percentage of the fair market value that is determined by local assessors to be the total taxable value of land and additions on the property. | Land | Improvement |
|---|---|---|---|---|
| 2025 | $3,085 | $223,200 | $87,800 | $135,400 |
| 2024 | $3,085 | $223,200 | $87,800 | $135,400 |
| 2023 | $2,982 | $223,200 | $87,800 | $135,400 |
| 2022 | $2,902 | $223,200 | $87,800 | $135,400 |
| 2021 | $3,529 | $245,400 | $143,500 | $101,900 |
| 2020 | $3,453 | $245,400 | $143,500 | $101,900 |
| 2019 | $3,367 | $245,400 | $143,500 | $101,900 |
| 2018 | $3,748 | $243,700 | $144,500 | $99,200 |
| 2017 | $3,191 | $213,900 | $130,500 | $83,400 |
| 2016 | $3,159 | $213,900 | $130,500 | $83,400 |
Source: Public Records
Map
Nearby Homes
- 0 Surf Dr
- 1 Knowlton Ct
- 461 North Ln
- 3 Knowlton Ct
- 7 Knowlton Ct
- 5 Knowlton Ct
- 1 Hydraulion Ave
- 2 Bagy Wrinkle Cove
- 35 Bagy Wrinkle Cove
- 667 Metacom Ave Unit 14
- 85 Canario Dr
- 0 Overhill Rd Unit 1382248
- 4 Harris Ave
- 8 Harris Ave
- 7 Broadview Ave
- 48 Narrows Rd
- 30 Sowams Dr
- 3 Betsy Dr
- 596 Metacom Ave
- 16 Smith St