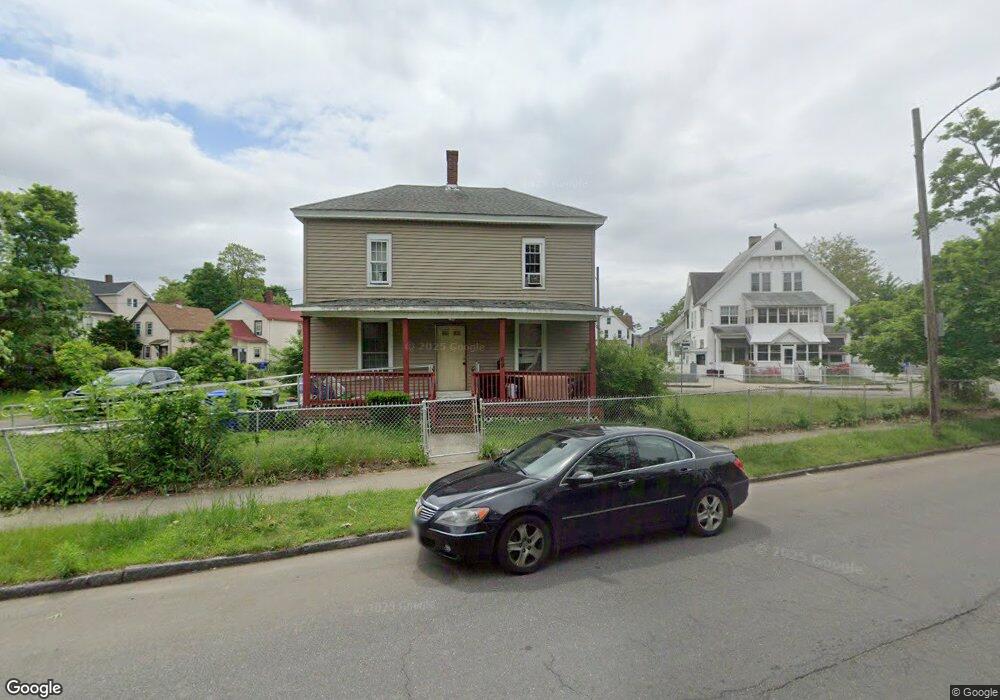
69 Cedar St Springfield, MA 01105
Maple-High Six Corners NeighborhoodEstimated Value: $228,000 - $281,000
3
Beds
2
Baths
1,421
Sq Ft
$173/Sq Ft
Est. Value
About This Home
This home is located at 69 Cedar St, Springfield, MA 01105 and is currently estimated at $245,552, approximately $172 per square foot. 69 Cedar St is a home located in Hampden County with nearby schools including Milton Bradley School, M Marcus Kiley Middle, and High School Of Commerce.
Ownership History
Date
Name
Owned For
Owner Type
Purchase Details
Closed on
Oct 31, 2003
Sold by
Jordan John R
Bought by
Jordan Emmett P
Current Estimated Value
Home Financials for this Owner
Home Financials are based on the most recent Mortgage that was taken out on this home.
Original Mortgage
$48,212
Outstanding Balance
$22,429
Interest Rate
6.05%
Mortgage Type
Purchase Money Mortgage
Estimated Equity
$223,123
Create a Home Valuation Report for This Property
The Home Valuation Report is an in-depth analysis detailing your home's value as well as a comparison with similar homes in the area
Home Values in the Area
Average Home Value in this Area
Purchase History
| Date | Buyer | Sale Price | Title Company |
|---|---|---|---|
| Jordan Emmett P | $50,000 | -- |
Source: Public Records
Mortgage History
| Date | Status | Borrower | Loan Amount |
|---|---|---|---|
| Open | Jordan Emmett P | $48,212 |
Source: Public Records
Tax History
| Year | Tax Paid | Tax Assessment Tax Assessment Total Assessment is a certain percentage of the fair market value that is determined by local assessors to be the total taxable value of land and additions on the property. | Land | Improvement |
|---|---|---|---|---|
| 2025 | $1,993 | $127,100 | $26,100 | $101,000 |
| 2024 | $1,916 | $119,300 | $24,400 | $94,900 |
| 2023 | $1,898 | $111,300 | $23,200 | $88,100 |
| 2022 | $1,651 | $87,700 | $21,100 | $66,600 |
| 2021 | $1,724 | $91,200 | $19,200 | $72,000 |
| 2020 | $1,662 | $85,100 | $19,200 | $65,900 |
| 2019 | $1,423 | $72,300 | $19,200 | $53,100 |
| 2018 | $1,515 | $77,000 | $19,200 | $57,800 |
| 2017 | $1,386 | $70,500 | $15,400 | $55,100 |
| 2016 | $1,256 | $63,900 | $15,400 | $48,500 |
| 2015 | $1,286 | $65,400 | $15,400 | $50,000 |
Source: Public Records
Map
Nearby Homes
Your Personal Tour Guide
Ask me questions while you tour the home.