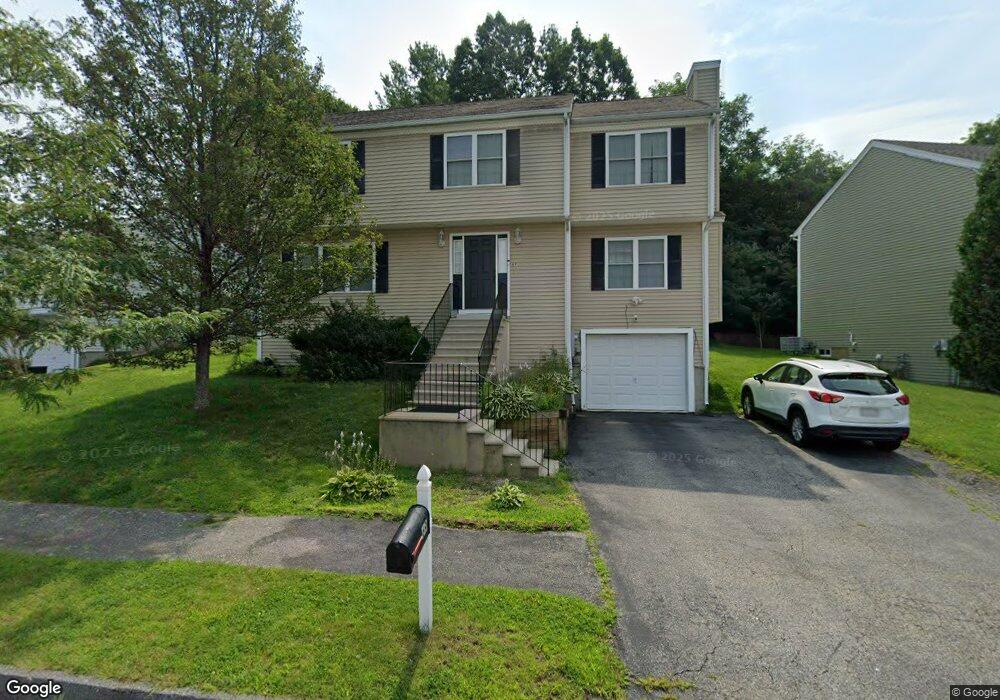
69 Cheyenne Rd Worcester, MA 01606
Indian Hill NeighborhoodEstimated Value: $573,276 - $659,000
4
Beds
3
Baths
2,152
Sq Ft
$287/Sq Ft
Est. Value
About This Home
This home is located at 69 Cheyenne Rd, Worcester, MA 01606 and is currently estimated at $617,819, approximately $287 per square foot. 69 Cheyenne Rd is a home located in Worcester County with nearby schools including Nelson Place Elementary School, Jacob Hiatt Magnet School, and Chandler Magnet.
Ownership History
Date
Name
Owned For
Owner Type
Purchase Details
Closed on
Dec 30, 2011
Sold by
Fnma
Bought by
Darbey Samuel W and Darbey Victorine E
Current Estimated Value
Home Financials for this Owner
Home Financials are based on the most recent Mortgage that was taken out on this home.
Original Mortgage
$244,637
Outstanding Balance
$167,876
Interest Rate
4%
Mortgage Type
Purchase Money Mortgage
Estimated Equity
$449,943
Purchase Details
Closed on
Oct 28, 2011
Sold by
Agyekum Edward K
Bought by
Federal National Mortgage Association
Purchase Details
Closed on
Dec 31, 2004
Sold by
Indian Hills Assoc Inc
Bought by
Agyekum Edward K and Sekyere-Abankwa Yvette
Home Financials for this Owner
Home Financials are based on the most recent Mortgage that was taken out on this home.
Original Mortgage
$279,920
Interest Rate
5.73%
Mortgage Type
Purchase Money Mortgage
Create a Home Valuation Report for This Property
The Home Valuation Report is an in-depth analysis detailing your home's value as well as a comparison with similar homes in the area
Home Values in the Area
Average Home Value in this Area
Purchase History
| Date | Buyer | Sale Price | Title Company |
|---|---|---|---|
| Darbey Samuel W | $251,000 | -- | |
| Federal National Mortgage Association | $214,016 | -- | |
| Agyekum Edward K | $349,900 | -- |
Source: Public Records
Mortgage History
| Date | Status | Borrower | Loan Amount |
|---|---|---|---|
| Open | Darbey Samuel W | $244,637 | |
| Previous Owner | Agyekum Edward K | $279,920 |
Source: Public Records
Tax History
| Year | Tax Paid | Tax Assessment Tax Assessment Total Assessment is a certain percentage of the fair market value that is determined by local assessors to be the total taxable value of land and additions on the property. | Land | Improvement |
|---|---|---|---|---|
| 2025 | $6,505 | $493,200 | $117,600 | $375,600 |
| 2024 | $6,408 | $466,000 | $117,600 | $348,400 |
| 2023 | $6,181 | $431,000 | $102,300 | $328,700 |
| 2022 | $5,786 | $380,400 | $81,800 | $298,600 |
| 2021 | $5,919 | $363,600 | $65,400 | $298,200 |
| 2020 | $5,765 | $339,100 | $65,400 | $273,700 |
| 2019 | $5,557 | $308,700 | $58,900 | $249,800 |
| 2018 | $5,501 | $290,900 | $58,900 | $232,000 |
| 2017 | $5,272 | $274,300 | $58,900 | $215,400 |
| 2016 | $5,311 | $257,700 | $42,800 | $214,900 |
| 2015 | $5,172 | $257,700 | $42,800 | $214,900 |
| 2014 | $5,035 | $257,700 | $42,800 | $214,900 |
Source: Public Records
Map
Nearby Homes
- 41 Mohave Rd
- 37 Mohave Rd
- 82 Holden St
- 42 N Worcester Ave
- 30 Danielles Way
- 120 Brattle St
- 270 Brattle St
- 39 Whitmarsh Ave
- 97 Parkton Ave
- 90 Bjorklund Ave
- 25 Chester St
- 667 Grove St
- 15 Ericsson St
- 158 Chester St
- 12 Tattan Farm Rd
- 11 Holden St
- 169 Whitmarsh Ave
- 44 Boardman St
- 39 Mountainshire Dr
- 331 Burncoat St
- 67 Cheyenne Rd
- 71 Cheyenne Rd
- 71 Cheyenne Rd Unit 1
- 65 Cheyenne Rd
- 73 Cheyenne Rd
- 45 Mohave Rd
- 72 Cheyenne Rd
- 74 Cheyenne Rd
- 63 Cheyenne Rd
- 29 Marconi Rd
- 27 Marconi Rd
- 43 Mohave Rd
- 75 Cheyenne Rd
- 75 Cheyenne Rd Unit 75
- 75 Cheyenne Rd Unit 1
- 21 Westinghouse Pkwy
- 61 Cheyenne Rd
- 25 Marconi Rd
- 49 Mohave Rd
- 21 Heroult Rd
Your Personal Tour Guide
Ask me questions while you tour the home.