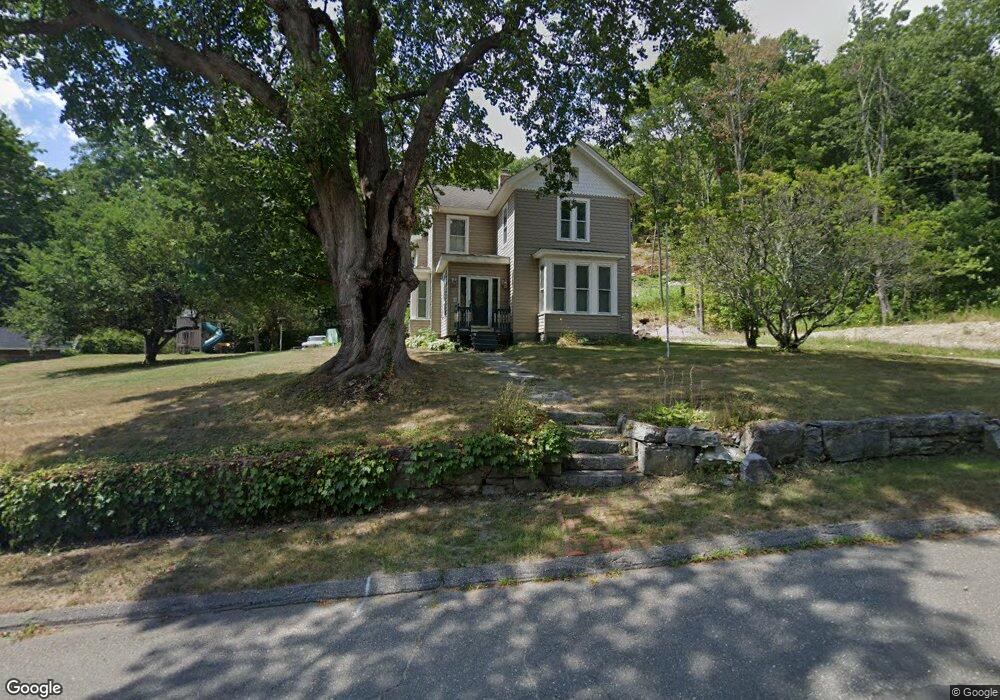
69 Crescent St Winsted, CT 06098
Estimated Value: $260,000 - $319,000
4
Beds
2
Baths
2,299
Sq Ft
$122/Sq Ft
Est. Value
About This Home
This home is located at 69 Crescent St, Winsted, CT 06098 and is currently estimated at $280,540, approximately $122 per square foot. 69 Crescent St is a home located in Litchfield County with nearby schools including Pearson School, Explorations Charter School, and St Anthony School.
Ownership History
Date
Name
Owned For
Owner Type
Purchase Details
Closed on
Mar 13, 1997
Sold by
Citicorp Mortgage Inc
Bought by
Tamminen Craig A
Current Estimated Value
Home Financials for this Owner
Home Financials are based on the most recent Mortgage that was taken out on this home.
Original Mortgage
$64,567
Interest Rate
7.79%
Mortgage Type
Unknown
Purchase Details
Closed on
Apr 1, 1996
Sold by
Ward John and Ward Malia
Bought by
Citicorp Mortgage
Purchase Details
Closed on
Sep 28, 1989
Sold by
Torneo Joseph
Bought by
Ward John
Home Financials for this Owner
Home Financials are based on the most recent Mortgage that was taken out on this home.
Original Mortgage
$128,200
Interest Rate
9.92%
Mortgage Type
Purchase Money Mortgage
Create a Home Valuation Report for This Property
The Home Valuation Report is an in-depth analysis detailing your home's value as well as a comparison with similar homes in the area
Home Values in the Area
Average Home Value in this Area
Purchase History
| Date | Buyer | Sale Price | Title Company |
|---|---|---|---|
| Tamminen Craig A | $72,000 | -- | |
| Tamminen Craig A | $72,000 | -- | |
| Citicorp Mortgage | $151,200 | -- | |
| Citicorp Mortgage | $151,200 | -- | |
| Ward John | $142,500 | -- |
Source: Public Records
Mortgage History
| Date | Status | Borrower | Loan Amount |
|---|---|---|---|
| Closed | Ward John | $66,300 | |
| Closed | Ward John | $64,567 | |
| Previous Owner | Ward John | $128,200 |
Source: Public Records
Tax History
| Year | Tax Paid | Tax Assessment Tax Assessment Total Assessment is a certain percentage of the fair market value that is determined by local assessors to be the total taxable value of land and additions on the property. | Land | Improvement |
|---|---|---|---|---|
| 2025 | $4,084 | $140,000 | $24,990 | $115,010 |
| 2024 | $3,814 | $140,000 | $24,990 | $115,010 |
| 2023 | $4,470 | $169,400 | $24,990 | $144,410 |
| 2022 | $3,362 | $100,240 | $18,200 | $82,040 |
| 2021 | $3,362 | $100,240 | $18,200 | $82,040 |
| 2020 | $3,362 | $100,240 | $18,200 | $82,040 |
| 2019 | $3,362 | $100,240 | $18,200 | $82,040 |
| 2018 | $3,362 | $100,240 | $18,200 | $82,040 |
| 2017 | $3,404 | $101,500 | $18,200 | $83,300 |
| 2016 | $3,404 | $101,500 | $18,200 | $83,300 |
| 2015 | $3,319 | $101,500 | $18,200 | $83,300 |
| 2014 | $3,239 | $101,500 | $18,200 | $83,300 |
Source: Public Records
Map
Nearby Homes
Your Personal Tour Guide
Ask me questions while you tour the home.