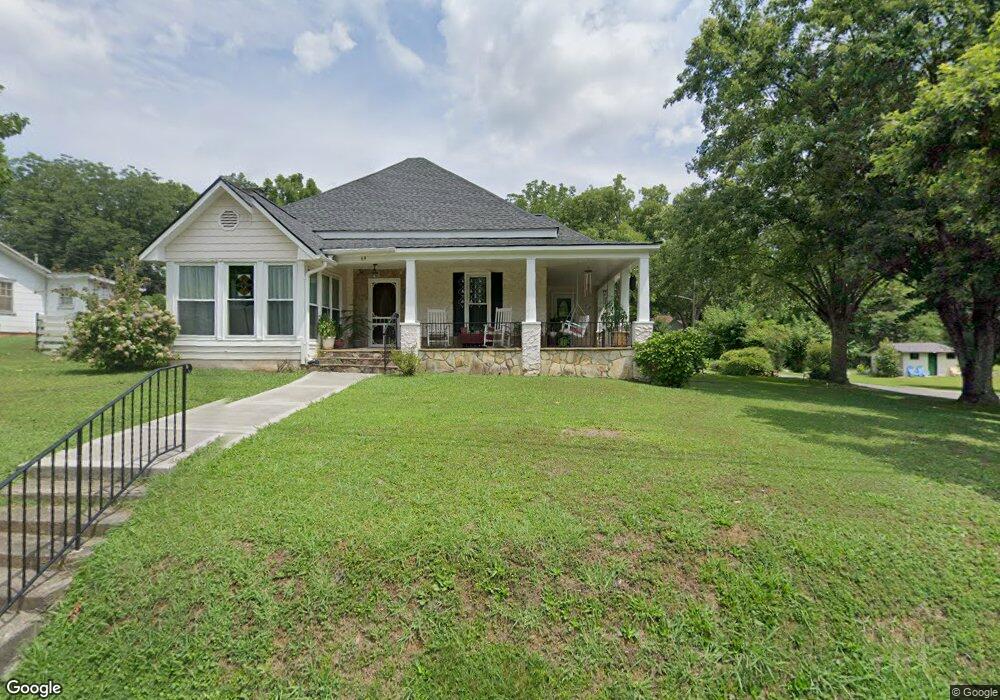
69 E Sellers St Jasper, GA 30143
Estimated Value: $353,000 - $433,000
Studio
2
Baths
2,541
Sq Ft
$157/Sq Ft
Est. Value
About This Home
This home is located at 69 E Sellers St, Jasper, GA 30143 and is currently estimated at $399,045, approximately $157 per square foot. 69 E Sellers St is a home located in Pickens County with nearby schools including Harmony Elementary School, Pickens County Middle School, and Pickens County High School.
Ownership History
Date
Name
Owned For
Owner Type
Purchase Details
Closed on
May 2, 2019
Sold by
Rau Linda P
Bought by
Rau Linda P and Rau Family Trust
Current Estimated Value
Purchase Details
Closed on
Mar 20, 2017
Sold by
Lawson Jeanette
Bought by
Shaw Colby S and Shaw Jenna
Purchase Details
Closed on
Sep 23, 2009
Sold by
Rau Charles F
Bought by
Rau Linda P
Purchase Details
Closed on
Jan 30, 2007
Sold by
Rau Charles Frederick
Bought by
Rau Charles Frederick
Purchase Details
Closed on
Oct 28, 2004
Sold by
Manus Glenn E
Bought by
Rau Charles F and Rau Linda P
Purchase Details
Closed on
Feb 5, 1992
Sold by
Britt Lois H
Bought by
Manus Glenn E and Manus Sue G
Purchase Details
Closed on
May 1, 1988
Sold by
Collett Lois H
Bought by
Britt Lois H
Purchase Details
Closed on
Dec 4, 1986
Sold by
Collett Henry W and Collett Lois H
Bought by
Collett Lois H
Purchase Details
Closed on
Jun 4, 1973
Bought by
Collett Henry W and Collett Lois H
Create a Home Valuation Report for This Property
The Home Valuation Report is an in-depth analysis detailing your home's value as well as a comparison with similar homes in the area
Home Values in the Area
Average Home Value in this Area
Purchase History
| Date | Buyer | Sale Price | Title Company |
|---|---|---|---|
| Rau Linda P | -- | -- | |
| Shaw Colby S | -- | -- | |
| Rau Linda P | -- | -- | |
| Rau Charles Frederick | -- | -- | |
| Rau Charles F | $189,000 | -- | |
| Rau Linda P | $189,000 | -- | |
| Manus Glenn E | $28,000 | -- | |
| Britt Lois H | -- | -- | |
| Collett Lois H | -- | -- | |
| Collett Henry W | $11,500 | -- |
Source: Public Records
Tax History
| Year | Tax Paid | Tax Assessment Tax Assessment Total Assessment is a certain percentage of the fair market value that is determined by local assessors to be the total taxable value of land and additions on the property. | Land | Improvement |
|---|---|---|---|---|
| 2025 | $3,620 | $150,245 | $14,000 | $136,245 |
| 2024 | $3,707 | $150,245 | $14,000 | $136,245 |
| 2023 | $3,787 | $150,245 | $14,000 | $136,245 |
| 2022 | $2,172 | $111,774 | $14,000 | $97,774 |
| 2021 | $1,871 | $90,878 | $12,000 | $78,878 |
| 2020 | $1,927 | $90,878 | $12,000 | $78,878 |
| 2019 | $1,972 | $90,878 | $12,000 | $78,878 |
| 2018 | $1,990 | $90,878 | $12,000 | $78,878 |
| 2017 | $2,023 | $90,878 | $12,000 | $78,878 |
| 2016 | $2,055 | $90,878 | $12,000 | $78,878 |
| 2015 | $2,007 | $90,878 | $12,000 | $78,878 |
| 2014 | $2,012 | $90,878 | $12,000 | $78,878 |
| 2013 | -- | $90,878 | $12,000 | $78,878 |
Source: Public Records
Map
Nearby Homes
- 8266 Cox Mountain Dr
- 365 Summit View Ln
- 288 Blazingstar Trail
- 0 Black Hawk Place Lot 242 Unit 7715035
- 0 Black Hawk Place Lot 242 Unit 10686039
- 365 Summit View Ln Unit 6
- TBD Cowart Mountain Tract 3 Rd
- 597 S Main St
- 87 Jones St
- 80 Jones St
- 190 Towne Villas Dr
- 24 N Rim Dr
- 28 Sandstone Dr
- 57 Towne Club Dr
- 5566 Red Fox Ln
- 0 Hunters Ridge Rd Unit 7714906
- 2668 Highland Trail
- 5574 Red Fox Ln
- 80 Mountain Mint Dr
- 0 Hunters Ridge Rd Unit 10685847
Your Personal Tour Guide
Ask me questions while you tour the home.