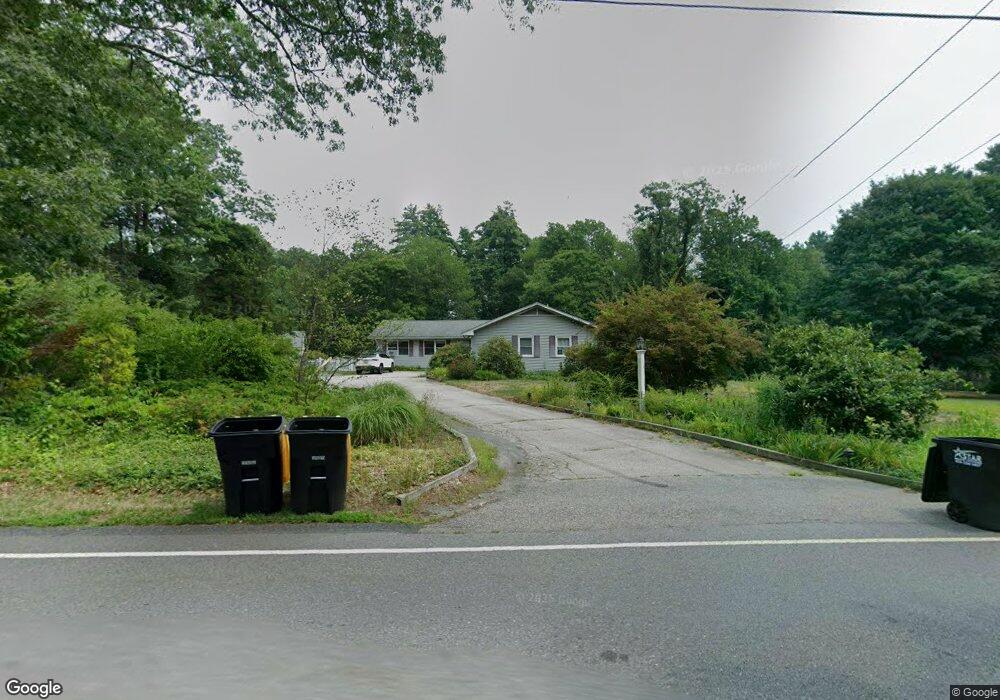
69 Freeman St Norton, MA 02766
Estimated Value: $698,000 - $865,000
3
Beds
4
Baths
2,551
Sq Ft
$310/Sq Ft
Est. Value
About This Home
This home is located at 69 Freeman St, Norton, MA 02766 and is currently estimated at $790,350, approximately $309 per square foot. 69 Freeman St is a home located in Bristol County with nearby schools including J.C. Solmonese Elementary School, Henri A. Yelle Elementary School, and Norton Middle School.
Ownership History
Date
Name
Owned For
Owner Type
Purchase Details
Closed on
May 24, 2023
Sold by
Powers Michael K and Powers Susan L
Bought by
Powers Susan L
Current Estimated Value
Purchase Details
Closed on
Oct 4, 2021
Sold by
Powers Susan L
Bought by
Powers Michael K and Powers Susan L
Home Financials for this Owner
Home Financials are based on the most recent Mortgage that was taken out on this home.
Original Mortgage
$305,600
Interest Rate
2.8%
Mortgage Type
New Conventional
Purchase Details
Closed on
Jun 8, 2016
Sold by
Powers Michael K and Powers Susan L
Bought by
Powers Susan L
Create a Home Valuation Report for This Property
The Home Valuation Report is an in-depth analysis detailing your home's value as well as a comparison with similar homes in the area
Home Values in the Area
Average Home Value in this Area
Purchase History
| Date | Buyer | Sale Price | Title Company |
|---|---|---|---|
| Powers Susan L | -- | None Available | |
| Powers Susan L | -- | None Available | |
| Powers Michael K | -- | None Available | |
| Powers Michael K | -- | None Available | |
| Powers Susan L | -- | -- | |
| Powers Susan L | -- | -- |
Source: Public Records
Mortgage History
| Date | Status | Borrower | Loan Amount |
|---|---|---|---|
| Previous Owner | Powers Michael K | $305,600 | |
| Previous Owner | Powers Susan L | $252,100 | |
| Previous Owner | Powers Susan L | $75,000 |
Source: Public Records
Tax History
| Year | Tax Paid | Tax Assessment Tax Assessment Total Assessment is a certain percentage of the fair market value that is determined by local assessors to be the total taxable value of land and additions on the property. | Land | Improvement |
|---|---|---|---|---|
| 2025 | $8,537 | $658,200 | $194,500 | $463,700 |
| 2024 | $8,034 | $620,400 | $185,200 | $435,200 |
| 2023 | $7,607 | $585,600 | $174,700 | $410,900 |
| 2022 | $7,397 | $518,700 | $158,800 | $359,900 |
| 2021 | $6,936 | $464,600 | $166,400 | $298,200 |
| 2020 | $6,679 | $451,300 | $161,500 | $289,800 |
| 2019 | $6,453 | $433,100 | $155,400 | $277,700 |
| 2018 | $6,158 | $406,200 | $155,400 | $250,800 |
| 2017 | $5,959 | $387,700 | $155,400 | $232,300 |
| 2016 | $5,474 | $350,700 | $155,400 | $195,300 |
| 2015 | $5,263 | $342,000 | $151,400 | $190,600 |
| 2014 | $5,012 | $326,100 | $144,200 | $181,900 |
Source: Public Records
Map
Nearby Homes
- 5 Robin Cir Unit 5
- 93 Mansfield Ave
- 157 Mansfield Ave Unit 14
- 95 Godfrey Dr
- 65 Godfrey Dr Unit 65
- 343 Godfrey Dr
- 26 Barrows Ct
- 34 Barrows St
- 20 Lloyd Cir Unit 32
- 14 Lloyd Cir Unit 29
- 143 Oak St Unit 10
- 2 Edgewater Dr Unit 2
- 268 Reservoir St
- 21 Juniper Rd
- 250 Mansfield Ave Unit 11
- 0 Brook Pkwy
- 0 Cobb St
- 170 S Worcester St Unit 3
- 90 Pine St
- 108 S Worcester St
Your Personal Tour Guide
Ask me questions while you tour the home.