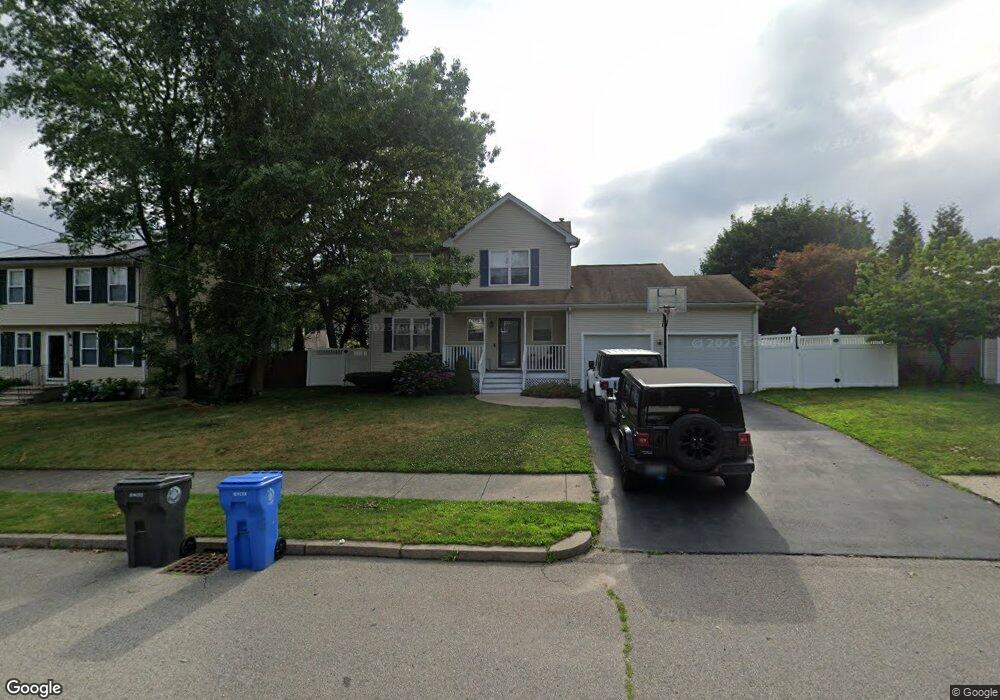
69 Laura Cir Cranston, RI 02920
Mayfield NeighborhoodEstimated Value: $597,000 - $663,000
3
Beds
3
Baths
1,780
Sq Ft
$351/Sq Ft
Est. Value
About This Home
This home is located at 69 Laura Cir, Cranston, RI 02920 and is currently estimated at $625,657, approximately $351 per square foot. 69 Laura Cir is a home located in Providence County with nearby schools including Garden City School, Western Hills Middle School, and Cranston High School West.
Ownership History
Date
Name
Owned For
Owner Type
Purchase Details
Closed on
Feb 27, 2013
Sold by
Smith Michael J and Menna Denise M
Bought by
Smith Michael J and Smith Densie M
Current Estimated Value
Purchase Details
Closed on
Feb 7, 2002
Sold by
Falcon Ridge Blder Lcl
Bought by
Menna Densie M
Home Financials for this Owner
Home Financials are based on the most recent Mortgage that was taken out on this home.
Original Mortgage
$185,500
Interest Rate
7.13%
Mortgage Type
Purchase Money Mortgage
Create a Home Valuation Report for This Property
The Home Valuation Report is an in-depth analysis detailing your home's value as well as a comparison with similar homes in the area
Home Values in the Area
Average Home Value in this Area
Purchase History
| Date | Buyer | Sale Price | Title Company |
|---|---|---|---|
| Smith Michael J | -- | -- | |
| Menna Densie M | $201,500 | -- |
Source: Public Records
Mortgage History
| Date | Status | Borrower | Loan Amount |
|---|---|---|---|
| Previous Owner | Menna Densie M | $210,000 | |
| Previous Owner | Menna Densie M | $204,000 | |
| Previous Owner | Menna Densie M | $185,500 |
Source: Public Records
Tax History Compared to Growth
Tax History
| Year | Tax Paid | Tax Assessment Tax Assessment Total Assessment is a certain percentage of the fair market value that is determined by local assessors to be the total taxable value of land and additions on the property. | Land | Improvement |
|---|---|---|---|---|
| 2025 | $7,083 | $510,300 | $138,400 | $371,900 |
| 2024 | $6,945 | $510,300 | $138,400 | $371,900 |
| 2023 | $6,653 | $352,000 | $99,000 | $253,000 |
| 2022 | $6,516 | $352,000 | $99,000 | $253,000 |
| 2021 | $6,336 | $352,000 | $99,000 | $253,000 |
| 2020 | $6,293 | $303,000 | $99,000 | $204,000 |
| 2019 | $6,293 | $303,000 | $99,000 | $204,000 |
| 2018 | $6,148 | $303,000 | $99,000 | $204,000 |
| 2017 | $6,274 | $273,500 | $84,900 | $188,600 |
| 2016 | $6,140 | $273,500 | $84,900 | $188,600 |
| 2015 | $6,140 | $273,500 | $84,900 | $188,600 |
| 2014 | $5,783 | $253,200 | $81,300 | $171,900 |
Source: Public Records
Map
Nearby Homes
- 16 Flynn Ave
- 61 Rose Hill Dr
- 16 Eastman St
- 33 Samuel Ct
- 112 Greenwich Ave
- 10 East St Unit 316
- 91 Ridgeway Rd
- 14 W Natick Rd
- 25 Stoneham St
- 11 Chaple Dr
- 115 Edman St
- 123 Edman St
- 20 Manilla Ave
- 37 Carriage Rd
- 269 Glen Hills Dr
- 46 Hornbeam Dr
- 1002 Williamsburg Cir
- 74 Pontiac St
- 995 Williamsburg Cir
- 61 Crossland Rd