Estimated Value: $294,000 - $341,000
3
Beds
1
Bath
1,005
Sq Ft
$316/Sq Ft
Est. Value
About This Home
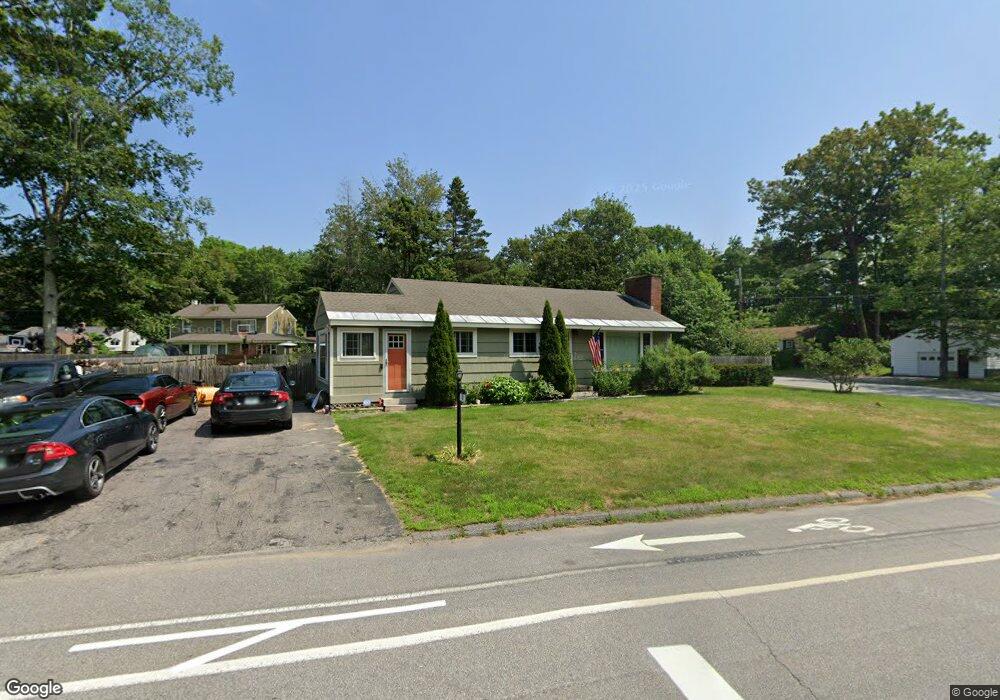
This home is located at 69 Pako Ave, Keene, NH 03431 and is currently estimated at $318,013, approximately $316 per square foot. 69 Pako Ave is a home located in Cheshire County with nearby schools including Greenlee Primary School, Keene Middle School, and Mayland Early College High School.
Ownership History
Date
Name
Owned For
Owner Type
Purchase Details
Closed on
Jun 30, 2009
Sold by
Department Of Housing & Urban Dev
Bought by
Symonds Stephen R
Current Estimated Value
Home Financials for this Owner
Home Financials are based on the most recent Mortgage that was taken out on this home.
Original Mortgage
$105,311
Outstanding Balance
$67,358
Interest Rate
4.92%
Mortgage Type
Unknown
Estimated Equity
$250,656
Purchase Details
Closed on
Oct 29, 2007
Sold by
Schillinger Todd A
Bought by
Nhfa
Purchase Details
Closed on
Aug 22, 2003
Sold by
Trombly Arthur L
Bought by
Schillinger Todd A and Schillinger Diane M
Home Financials for this Owner
Home Financials are based on the most recent Mortgage that was taken out on this home.
Original Mortgage
$136,800
Interest Rate
5.52%
Purchase Details
Closed on
May 10, 2001
Sold by
Adams Mary C
Bought by
Trombly Arthur L
Home Financials for this Owner
Home Financials are based on the most recent Mortgage that was taken out on this home.
Original Mortgage
$261,500
Interest Rate
6.88%
Create a Home Valuation Report for This Property
The Home Valuation Report is an in-depth analysis detailing your home's value as well as a comparison with similar homes in the area
Home Values in the Area
Average Home Value in this Area
Purchase History
| Date | Buyer | Sale Price | Title Company |
|---|---|---|---|
| Symonds Stephen R | $111,400 | -- | |
| Nhfa | $151,300 | -- | |
| Schillinger Todd A | $141,900 | -- | |
| Trombly Arthur L | $79,000 | -- |
Source: Public Records
Mortgage History
| Date | Status | Borrower | Loan Amount |
|---|---|---|---|
| Open | Trombly Arthur L | $105,311 | |
| Previous Owner | Trombly Arthur L | $136,800 | |
| Previous Owner | Trombly Arthur L | $261,500 |
Source: Public Records
Tax History Compared to Growth
Tax History
| Year | Tax Paid | Tax Assessment Tax Assessment Total Assessment is a certain percentage of the fair market value that is determined by local assessors to be the total taxable value of land and additions on the property. | Land | Improvement |
|---|---|---|---|---|
| 2024 | $6,756 | $204,300 | $46,900 | $157,400 |
| 2023 | $6,515 | $204,300 | $46,900 | $157,400 |
| 2022 | $6,339 | $204,300 | $46,900 | $157,400 |
| 2021 | $6,391 | $204,300 | $46,900 | $157,400 |
| 2020 | $5,719 | $153,400 | $55,000 | $98,400 |
| 2019 | $5,768 | $153,400 | $55,000 | $98,400 |
| 2018 | $5,694 | $153,400 | $55,000 | $98,400 |
| 2017 | $5,654 | $151,900 | $53,500 | $98,400 |
| 2016 | $5,528 | $151,900 | $53,500 | $98,400 |
| 2015 | $5,041 | $146,500 | $60,600 | $85,900 |
Source: Public Records
Map
Nearby Homes
- 106 Pako Ave
- 11 Nut Hatch Ln
- 115 Liberty Ln
- 17 Blue Jay Ct
- 64 Old Walpole Rd
- 184 Kennedy Dr
- 792 Court St Unit A
- 21 Glen Rd
- 32a Stonehouse Ln
- 5 Surry Hill Dr
- 28 Stonehouse Ln
- 38 Stonehouse Ln Unit A
- 89 Kendall Rd
- 39 Windsor Ct Unit B
- 257 Park Ave
- 224 Darling Rd
- 220 Hurricane Rd
- 0 Stevens St Unit 1
- 18 Stanton Ct
- 7 Newman St