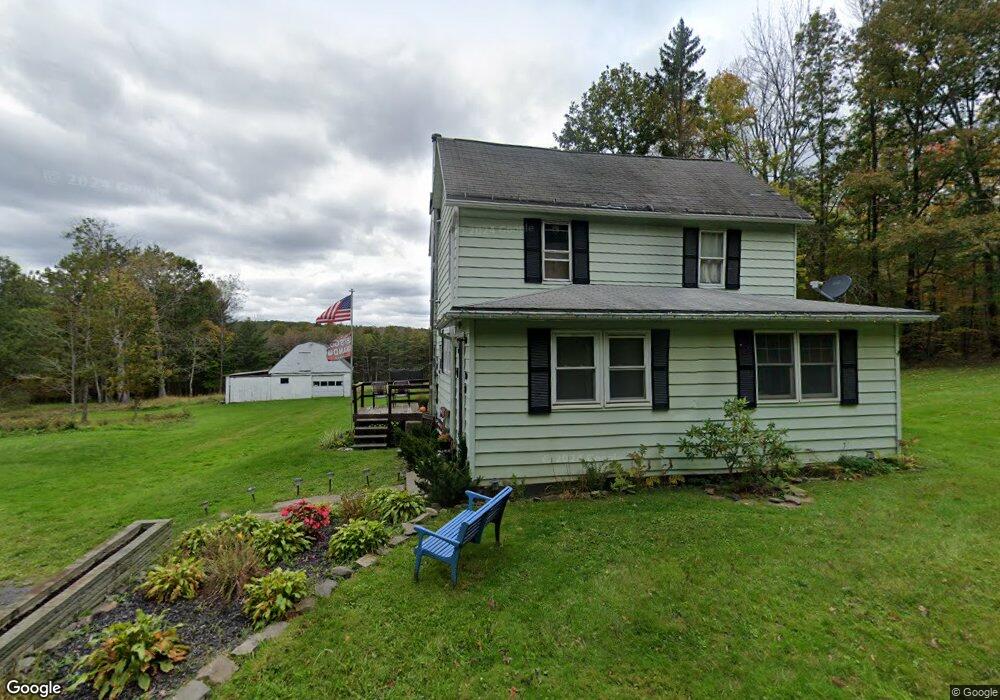
69 Peg Leg Rd Windsor, NY 13865
Estimated Value: $102,000 - $150,000
3
Beds
1
Bath
992
Sq Ft
$124/Sq Ft
Est. Value
About This Home
This home is located at 69 Peg Leg Rd, Windsor, NY 13865 and is currently estimated at $122,987, approximately $123 per square foot. 69 Peg Leg Rd is a home located in Broome County with nearby schools including C.R. Weeks Elementary School and Windsor Central High School.
Ownership History
Date
Name
Owned For
Owner Type
Purchase Details
Closed on
Nov 30, 2016
Sold by
Deyo Michael
Bought by
Deyo Cody J
Current Estimated Value
Home Financials for this Owner
Home Financials are based on the most recent Mortgage that was taken out on this home.
Original Mortgage
$39,524
Outstanding Balance
$32,407
Interest Rate
4.03%
Mortgage Type
FHA
Estimated Equity
$90,580
Purchase Details
Closed on
Jun 18, 2014
Sold by
Olson Christopher S
Bought by
Deyo Michael P
Purchase Details
Closed on
Aug 12, 2004
Sold by
Koston
Bought by
Sec Of Hud
Purchase Details
Closed on
Jul 13, 2001
Sold by
Hopfer Howard L
Bought by
Severance Glenn E
Create a Home Valuation Report for This Property
The Home Valuation Report is an in-depth analysis detailing your home's value as well as a comparison with similar homes in the area
Home Values in the Area
Average Home Value in this Area
Purchase History
| Date | Buyer | Sale Price | Title Company |
|---|---|---|---|
| Deyo Cody J | $45,700 | None Available | |
| Deyo Michael P | $35,000 | None Available | |
| Sec Of Hud | -- | Berkman Henoch Etc | |
| Severance Glenn E | $58,300 | Frederick Xlander |
Source: Public Records
Mortgage History
| Date | Status | Borrower | Loan Amount |
|---|---|---|---|
| Open | Deyo Cody J | $39,524 |
Source: Public Records
Tax History Compared to Growth
Tax History
| Year | Tax Paid | Tax Assessment Tax Assessment Total Assessment is a certain percentage of the fair market value that is determined by local assessors to be the total taxable value of land and additions on the property. | Land | Improvement |
|---|---|---|---|---|
| 2024 | $2,699 | $54,500 | $16,400 | $38,100 |
| 2023 | $2,733 | $54,500 | $16,400 | $38,100 |
| 2022 | $2,578 | $54,500 | $16,400 | $38,100 |
| 2021 | $2,565 | $54,500 | $16,400 | $38,100 |
| 2020 | $2,511 | $54,500 | $16,400 | $38,100 |
| 2019 | $0 | $54,500 | $16,400 | $38,100 |
| 2018 | $2,454 | $54,500 | $16,400 | $38,100 |
| 2017 | $2,438 | $54,500 | $16,400 | $38,100 |
| 2016 | $2,450 | $54,500 | $16,400 | $38,100 |
| 2015 | -- | $54,500 | $16,400 | $38,100 |
| 2014 | -- | $54,500 | $16,400 | $38,100 |
Source: Public Records
Map
Nearby Homes