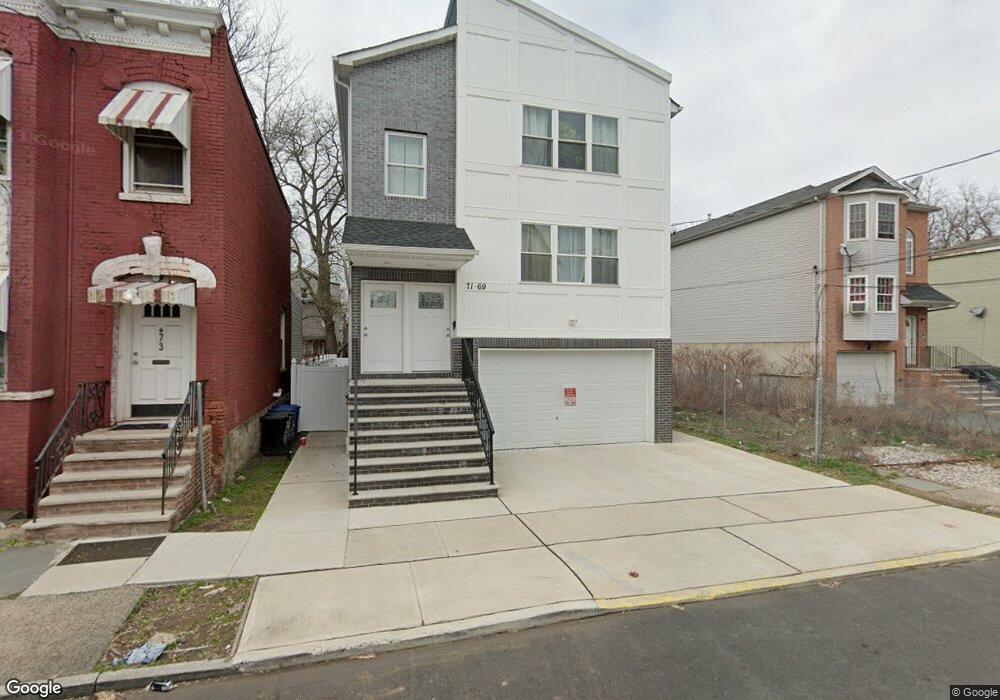
69 S 12th St Newark, NJ 07107
Fairmount NeighborhoodEstimated Value: $837,847
7
Beds
5
Baths
4,160
Sq Ft
$201/Sq Ft
Est. Value
About This Home
This home is located at 69 S 12th St, Newark, NJ 07107 and is currently estimated at $837,847, approximately $201 per square foot. 69 S 12th St is a home located in Essex County with nearby schools including Harriet Tubman School, Sir Isaac Newton Elementary School, and Camden Street Elementary School.
Ownership History
Date
Name
Owned For
Owner Type
Purchase Details
Closed on
Dec 28, 2020
Sold by
Newark Portfolio Llc
Bought by
Hernandez Alfa and Rosario-Hernandez Edry
Current Estimated Value
Home Financials for this Owner
Home Financials are based on the most recent Mortgage that was taken out on this home.
Original Mortgage
$564,585
Outstanding Balance
$502,915
Interest Rate
2.6%
Mortgage Type
FHA
Estimated Equity
$334,932
Purchase Details
Closed on
Aug 26, 2019
Sold by
Linman Investments Llc
Bought by
Newark Portfolio Llc
Purchase Details
Closed on
Dec 2, 2005
Sold by
Sherrer Darnell
Bought by
Linman Investments Llc
Create a Home Valuation Report for This Property
The Home Valuation Report is an in-depth analysis detailing your home's value as well as a comparison with similar homes in the area
Home Values in the Area
Average Home Value in this Area
Purchase History
| Date | Buyer | Sale Price | Title Company |
|---|---|---|---|
| Hernandez Alfa | $575,000 | Westcor Land Title | |
| Newark Portfolio Llc | $76,000 | -- | |
| Linman Investments Llc | $147,500 | -- |
Source: Public Records
Mortgage History
| Date | Status | Borrower | Loan Amount |
|---|---|---|---|
| Open | Hernandez Alfa | $564,585 |
Source: Public Records
Tax History Compared to Growth
Tax History
| Year | Tax Paid | Tax Assessment Tax Assessment Total Assessment is a certain percentage of the fair market value that is determined by local assessors to be the total taxable value of land and additions on the property. | Land | Improvement |
|---|---|---|---|---|
| 2025 | -- | $342,500 | $22,800 | $319,700 |
| 2024 | -- | $342,500 | $22,800 | $319,700 |
| 2022 | $851 | $342,500 | $22,800 | $319,700 |
| 2021 | $851 | $22,800 | $22,800 | $0 |
| 2020 | $1,900 | $50,000 | $50,000 | $0 |
| 2019 | $858 | $22,800 | $22,800 | $0 |
| 2018 | $842 | $22,800 | $22,800 | $0 |
| 2017 | $812 | $22,800 | $22,800 | $0 |
| 2016 | $784 | $22,800 | $22,800 | $0 |
| 2015 | $754 | $22,800 | $22,800 | $0 |
| 2014 | $707 | $22,800 | $22,800 | $0 |
Source: Public Records
Map
Nearby Homes