Estimated Value: $131,000 - $175,000
--
Bed
--
Bath
3,196
Sq Ft
$49/Sq Ft
Est. Value
About This Home
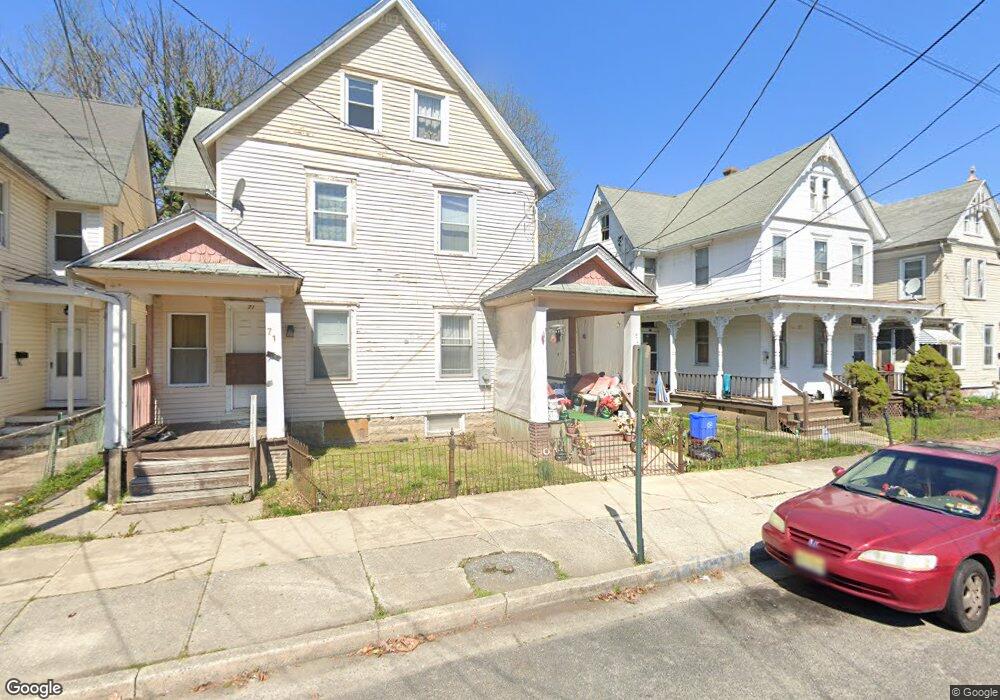
This home is located at 69 Seventh St Unit 71, Salem, NJ 08079 and is currently estimated at $156,246, approximately $48 per square foot. 69 Seventh St Unit 71 is a home located in Salem County with nearby schools including John Fenwick Elementary School, Salem Middle School, and Salem High School.
Ownership History
Date
Name
Owned For
Owner Type
Purchase Details
Closed on
Mar 20, 2025
Sold by
Gura Ruchama
Bought by
165 Shore 1 Llc
Current Estimated Value
Purchase Details
Closed on
Nov 3, 2011
Sold by
Walnut Investments Inc
Bought by
Gura Ruchama
Purchase Details
Closed on
Apr 15, 2011
Sold by
Kondaur Capital Corp
Bought by
Walnut Investments Inc
Purchase Details
Closed on
Dec 13, 2010
Sold by
Speight Lewis B
Bought by
Kondaur Capital Corp
Purchase Details
Closed on
Jun 29, 2007
Sold by
Ayares Doris F
Bought by
Speight Lewis B
Home Financials for this Owner
Home Financials are based on the most recent Mortgage that was taken out on this home.
Original Mortgage
$88,000
Interest Rate
8.95%
Mortgage Type
New Conventional
Create a Home Valuation Report for This Property
The Home Valuation Report is an in-depth analysis detailing your home's value as well as a comparison with similar homes in the area
Home Values in the Area
Average Home Value in this Area
Purchase History
| Date | Buyer | Sale Price | Title Company |
|---|---|---|---|
| 165 Shore 1 Llc | $120,000 | Dekel Abstract | |
| 165 Shore 1 Llc | $120,000 | Dekel Abstract | |
| Gura Ruchama | $69,000 | -- | |
| Walnut Investments Inc | $35,000 | -- | |
| Kondaur Capital Corp | $85,000 | -- | |
| Speight Lewis B | $110,000 | -- |
Source: Public Records
Mortgage History
| Date | Status | Borrower | Loan Amount |
|---|---|---|---|
| Previous Owner | Speight Lewis B | $88,000 |
Source: Public Records
Tax History Compared to Growth
Tax History
| Year | Tax Paid | Tax Assessment Tax Assessment Total Assessment is a certain percentage of the fair market value that is determined by local assessors to be the total taxable value of land and additions on the property. | Land | Improvement |
|---|---|---|---|---|
| 2025 | $4,465 | $54,300 | $8,800 | $45,500 |
| 2024 | $4,269 | $54,300 | $8,800 | $45,500 |
| 2023 | $4,269 | $54,300 | $8,800 | $45,500 |
| 2022 | $4,082 | $54,300 | $8,800 | $45,500 |
| 2021 | $3,941 | $54,300 | $8,800 | $45,500 |
| 2020 | $3,862 | $54,300 | $8,800 | $45,500 |
| 2019 | $3,838 | $54,300 | $8,800 | $45,500 |
| 2018 | $3,754 | $54,300 | $8,800 | $45,500 |
| 2017 | $3,709 | $54,300 | $8,800 | $45,500 |
| 2016 | $3,172 | $81,000 | $14,500 | $66,500 |
| 2015 | $3,131 | $81,000 | $14,500 | $66,500 |
| 2014 | $3,115 | $81,000 | $14,500 | $66,500 |
Source: Public Records
Map
Nearby Homes